When Something Goes Wrong
A run that does not do what was expected has usually already said why, somewhere. This page is about
which somewhere — the four lists on the Execution page at /execution, the Program branch at
Control-Tree path execution/program, and the service's own log.
Start with the right list
The Session Messages panel, below the canvas, splits the session's messages across four lists, and picking the right one is most of the diagnosis. A tab carries a count only once its list has something in it, so a tab with no number beside its name is a sink nothing has reached.
- Shell — the session's own account of itself: what started, what finished, what it built, and
the verdicts it reaches at the end of a play. A conversion or an optimization reports itself here
too, stage by stage and file by file, from its opening row to its closing count. These rows carry
no anchor, because there is nothing
in the program to anchor them to. This is the list a run that appears to have done nothing is
diagnosed from: a play that ends with no step having touched the workpiece is reported here, and
the message names the usual causes — an incremental header with no
G90after it, a work offset or program zero that puts the program somewhere else, stock that is not where the program expects it. - NC Diagnostics — everything the NC pipeline said while playing, which is not only complaints. It opens each file with the line count it found, and a row about one sentence carries an anchor naming it. This is the list to read when the program did not do what its text says.
- Step Diagnostics — anchored to a machining step rather than to a position in the text. Most of it is about motion, but not all: an NC-embedded script that fails to compile is reported here too, against the step it was reached from.
- NC Manipulation — what the writeback found in the program while converting it to NC files or optimizing it: a block whose words it would not rewrite, an edit that matched no piece in the stream, a block the optimizer would not re-interpolate and optimized whole instead, a split arc whose written fragments no longer share one radius. It holds findings and nothing else, so a conversion or an optimization with nothing to complain about leaves this list empty; the run's own account of itself is on Shell.
A message about a G word and a message about a move are different problems, and they never share a
list. Looking in the wrong one reads as silence.
Reading a row
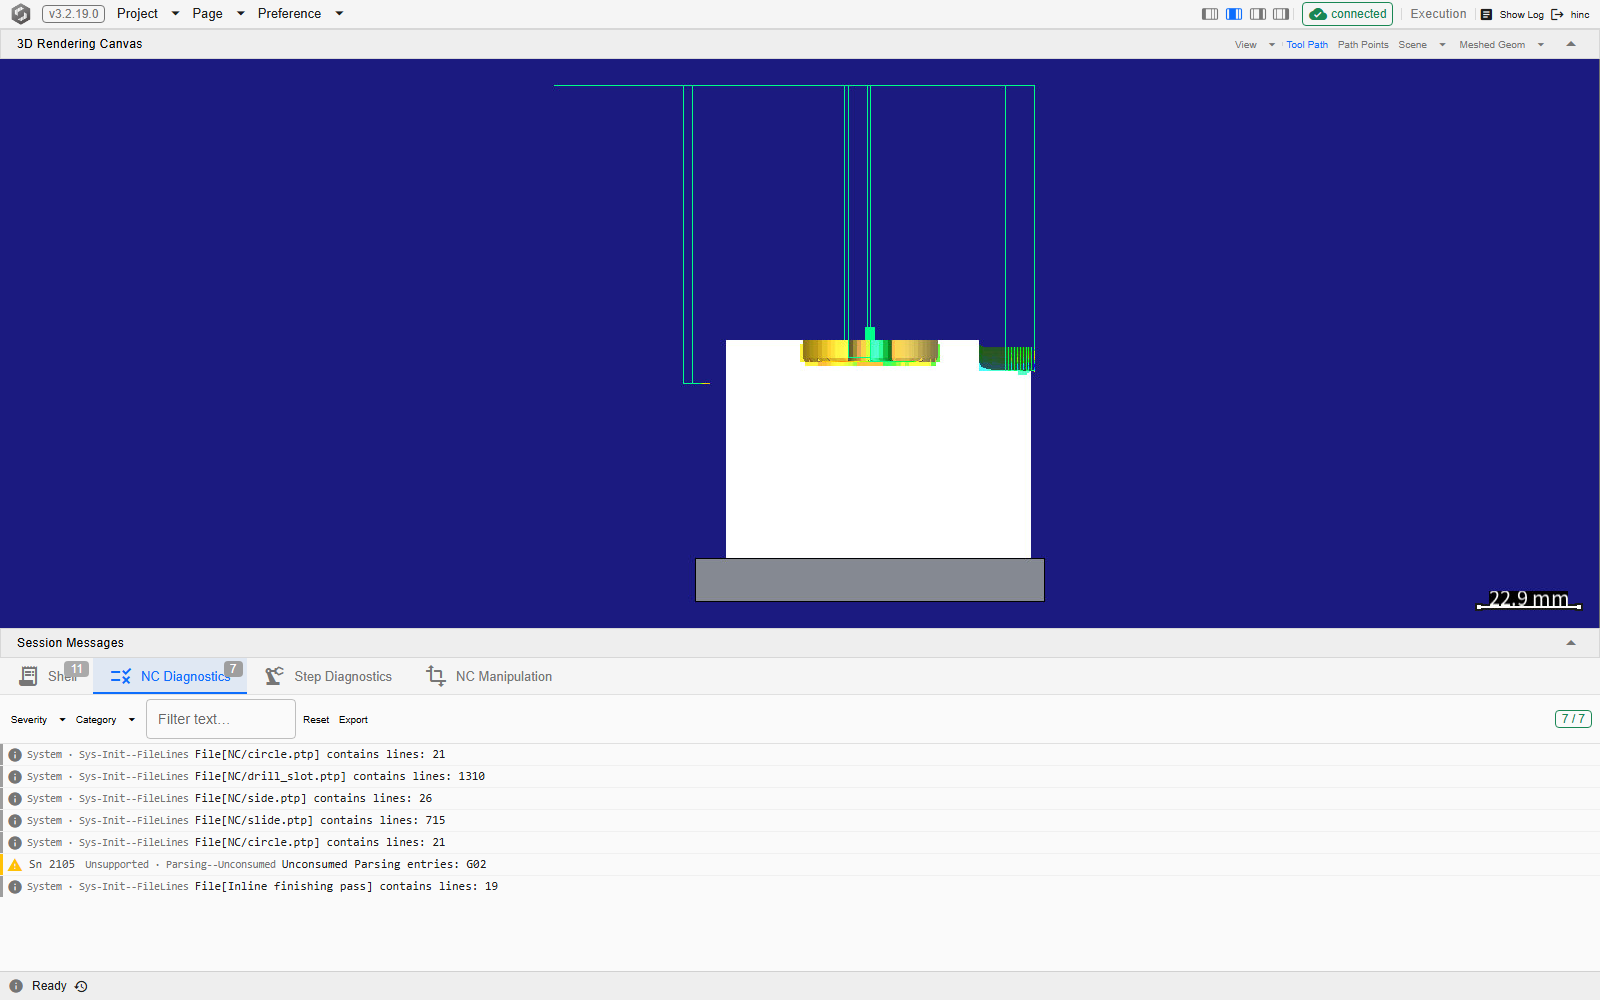
The four lists at /execution, with NC Diagnostics selected. Two of the four tabs carry no badge,
which is how an empty sink looks.
A row carries, left to right, the position it is about, the category, the message's own id, and its
text. The position is the anchor: Sn and a number for a sentence, S and a number for a step. Not
every row has one — a complaint about the pipeline rather than about a particular sentence has
nothing to anchor to, and neither has anything on Shell.
The id is worth reading. It is stable across languages and releases, so it is the thing to quote when asking someone else about a message, and the thing to filter on when one message is repeating. The Filter text… box, the Severity and Category lists and Export are described with the rest of the panel in Messages and Logs.
Important
On the two NC lists, a row is not an occurrence. NC Diagnostics folds across a play and NC Manipulation across one conversion or optimization run; Shell and Step Diagnostics fold nothing, and every report they take becomes a row of its own. Where it applies, the pipeline keeps one entry per distinct message — same id, same wording — and drops every repeat instead of listing it. When the program ends, each message that occurred more than once gets one summary row reading repeated N times in this run, first at the sentence it was first seen on. So a diagnostic raised on forty different sentences leaves two rows for that program: the first occurrence, and the summary.
Two consequences are worth holding on to. The count is only in that summary sentence — the multiplier badge that marks consecutive identical messages is a different mechanism and does not appear on these. And the summary row's anchor is the last occurrence while its text names the first, so jumping from it lands at the end of the run of repeats, not at the beginning. Everything between the two rows has no anchor at all: to find those positions, fix the first one and play again.
Then the run's own record
The Program branch holds what the run did to each line — the passes it made and the marks each one left. A line that was expected to cut and was not marked was not executed in that pass. See The Program Branch.
The two records answer different questions and are worth reading together: NC Diagnostics says what the pipeline thought of a sentence while it was playing, the Program branch says what that sentence produced.
Then the service log
Show Log on the menu bar opens the log the service is writing for the current day, with a Download for sending it to someone else. It holds things the four lists never carry — the exception behind a failure, and the engine's own start-up account of itself — and it is the only one of these surfaces that outlives the session. What it does not hold is the four lists: those are pushed to the browser and are never written to the file, so a message seen in a list is not findable there. The viewer itself is described in Messages and Logs.
While an optimization is running
An optimization reports itself on Shell, stage by stage. It opens with Start NC optimization. and ends with Total N files optimized. and optimization cache cleared., and between them every stage announces itself as it begins: Computing Optimized Feed by indivisual step.., closed by Optimization Feedrate built. once the per-step feeds are solved, then Constrain feedrate By expaneded segment.., Constrain Feedrate By Acceleration.., Build Compensation.. and Regenerate NC commands.., with one File optimized: row naming each output file as it is finished.
Two of those stages count aloud, and they are the only way to tell a slow optimization from a stopped one. While the per-step feeds are being solved, every thousandth step adds another Computing Optimized Feed by indivisual step.. row carrying the source file and line it has reached; while the optimized text is being written, every thousandth line adds a Now optimizing to: row carrying the same two numbers. Shell appends every one of them and folds nothing, so its newest row is where the run has got to: numbers that keep advancing are a run still working, and a list that has stopped growing on a stage whose successor has not been announced is a run that is not.
The counting rows are the instrument, not the stage rows. A stage with fewer than a thousand steps to solve, or fewer than a thousand lines to write, announces its start and then says nothing until it ends — so a short program crosses the whole ladder in near-silence, and that silence means nothing on its own.
A Stop ends an optimization on a success row. Stop reaches the optimizer between steps and between output files rather than only at the end, and what it leaves on Shell is optimization canceled. followed immediately by Total N files optimized. in success green — even Total 0 files optimized. arrives as a success. The count is of the files the run had opened, so a file the Stop landed part-way through is counted with the rest and is left on disk short. The complete ones are those whose own File optimized: row appeared before the cancel.
Three things that look like faults and are not
An English message in a translated interface is the safe answer, not a bug. Engine messages arrive with an id and their English text, and the interface substitutes its own translation only when its copy of that message matches the one the engine sent. An engine built against a different message set, or a message the interface has no copy of, leaves the original English in place rather than rendering text that might say something else. The English is the accurate text.
An action refused because a run is playing is a guard, not a fault. Switching the NC runner and switching the controller brand are both refused while a program is playing, rather than swapping the parser underneath it; the refusal names the reason and asks for the run to be paused or finished first. It arrives on the action itself — no row is added to any of the four lists, so there is nothing to go looking for afterwards.
An empty Step Diagnostics list is not proof that nothing was wrong. Collision detection is off unless the mission turns it on, and the physics-dependent warnings — the cutter geometry checks raised at tool change among them — are not raised at all when physics is off. A quiet list on a run with those switched off says only that nothing was being watched for.
If it is a configuration problem rather than a run problem
Some failures are the setup answering late. A cutter whose upper beam is shorter than its flute cannot build its thermal shell. The Upper Beam editor flags it while the tool is being edited, and a run that equips that tool reports it again at tool change, in Step Diagnostics — provided physics is on, which is what makes that check run. See Cutter Geometry.
See Also
- Running a Simulation — the rest of running a job
- Starting and Stepping — the transport, and the run state this page reads
- The Program Branch — what the run recorded against each line
- Messages and Logs — the panel these four lists live in, the footer, and the service's log viewer