Messages and Logs
Where a message lands decides how long it lasts and who else can see it, and that is usually more useful than what it said at the time. The toasts and the footer belong to one browser and are gone at its next reload; the four session message lists and the day's log file are held by the service. Picking the right surface is most of the difference between a specific question and a vague one.
Where a message can land
The application has several places to put a message, and they do not carry the same things.
- A toast — bottom right, for a few seconds, then gone. The only surface that interrupts, and the only one that keeps nothing itself.
- The footer's latest line, and the recent list behind it — a toast is copied here before it is shown, so this list is the toast's afterlife. Two kinds never arrive: a toast carrying neither message nor caption, and the notices Tool House, the Spindle Capability editor and the Controller panels raise, which are shown once and not kept. A small number of status lines go the other way — written straight here, and never toasted at all.
- The footer's session strip — the middle of the bar, drawn once a run has produced something and empty until then.
- The footer's background zone — the right end, drawn only while one of the Project menu's operations is in flight — Close Project included — naming the operation and the path it is working on.
- The Session Messages panel — on the Execution page, four lists kept by the service.
- The Log Viewer — the file the service itself writes for the current day.
The footer summarises; it does not hold. Everything a run reports also goes into one of the panel's four lists, and the panel is where it stays.
Messages a project load raises
Opening or re-reading a project can report holes in it — a referenced STL missing from disk, or a runner configuration the file names that would not load, leaving the project on a default one. None of these fail the load. The project opens, the body that needed the missing file simply comes up without its geometry, and the action still reports success. The message is the only thing that says otherwise.
Two neighbouring cases go elsewhere. A mesh-geometry .wct file a raw geometry names but that is not
there raises nothing here at all, because the load never opens it; the first word about it comes when
the meshed geometry is next needed, and that message belongs to the run, so it lands in the Session
Messages panel like any other. A side file the project names as a reference — the machine chain, the
spindle capability, a material, a cutting parameter set — is the opposite case: a missing one fails
the load outright, and that arrives as an error rather than as one of the messages described here.
See Projects.
These messages then take a path of their own, and it has a consequence worth knowing before that path is relied on. A project file operation runs outside any session, so the panel's four lists — which belong to the service, and are where everything a run reports stays — never see them. Instead the first five errors and warnings are toasted, anything past that goes straight to the footer's recent list, and one more toast says how many did not get their own. Anything milder than a warning is not surfaced in the window at all.
That leaves the footer's recent list holding the only copy in the window, and that list is the browser's: a reload empties it. So read the messages when a project opens with pieces missing, or read the service log, which has them either way. The Session Messages panel will not.
The footer
The left region is this browser's own record and nothing else's. The list behind the latest line is newest first, capped at a hundred entries, emptied by its Clear button — which takes the latest line back to Ready with it — and by a reload, and written down nowhere — nothing about it survives closing the tab. Each entry keeps the wording it was raised in, so switching the language leaves the list as a mixture while the panel's lists re-render at once. The frame page describes the regions themselves: see The Application Window.
Nothing marks the list as having something new in it. The button carries no badge and no dot, deliberately, because a toast has already drawn attention once. The consequence is the failure this page exists to prevent: a message that never toasted at all, or one whose few seconds expired while the window was behind something else, is invisible until that menu is opened by hand. Opening it after an action that seemed to do nothing is the cheapest check available.
The middle strip is the other way round — the service pushes it, so every connected browser sees the
same run activity, and each browser keeps its own short ring of the last entries behind it. What it
last showed stays on the bar after the run has ended; a project change is what empties the ring and
takes the strip away with it. A cursor line carries Sn and the sentence index it sits on; a
message line carries whatever anchor the message supplies. Two limits are worth knowing: the strip
mirrors the newest message across three of the four lists — nothing from NC Manipulation reaches
it — and it is sampled rather than recorded, so messages arriving faster than it refreshes never
appear on it at all. The lists on the service drop nothing.
The session message panel
The panel sits on the Execution page, in the middle column, below the 3D Rendering Canvas. Its header row reads Session Messages and stays visible when the panel is collapsed, so a grey strip with that name on it is the panel, shut.
The whole column can be switched off, and nothing on the page says so. The column quick-toggles at the right-hand end of the menu bar include one whose tooltip reads Toggle the Execution canvas & messages column; with it off, neither the panel nor its header row is drawn, and the page simply looks like it has fewer parts. That choice is the browser's and survives a reload. The expanded or collapsed state of the panel itself is not: it is kept by the service, and is therefore the same for every browser that opens the page afterwards.
Four tabs, each a separate list:
| Tab | What it holds |
|---|---|
| Shell | The session's own lifecycle and routine progress — what began, what finished, what was refused. It is empty outside a session, because the list is created with the session. |
| NC Diagnostics | What the NC pipeline reported while playing a program. |
| Step Diagnostics | What was reported against a machining step rather than against program text. |
| NC Manipulation | What converting a played program to NC, or optimising one, reported. Each such run clears the list before it starts filling it again. |
A tab shows a small count badge only once its list has something in it, so an empty sink is a tab with nothing beside its name.
Where a message carries a position, the row shows it in a monospaced anchor column: a step diagnostic names its step, and its block as well when it has one; an NC diagnostic names the block's position in execution order, and its tooltip adds the source file and line where the diagnostic carries them. Not every NC diagnostic has one — a complaint about the pipeline rather than about a particular block has no anchor to show, and shell messages never have one. A run of consecutive identical messages arrives already folded into a single row with a multiplier badge. A row with more behind its one line carries a chevron; clicking it opens what the message brought with it, with a Copy of its own.
Each tab filters independently: a Severity list, a Category list, a Filter text… box, and a Reset. The badge at the right of that toolbar reads two numbers separated by a slash, and they count different things — rows currently shown on the left, raw messages on the right, so folding alone makes them differ, and on a long session the left number stops at the most recent thousand while the right goes on counting. That badge is also the tab's connection indicator: it is outlined green only while the connection behind that list is up, and its tooltip names the state. Export writes the tab's filtered rows to a CSV file.
Important
Two different controls on this screen answer to Reset, and only one of them is labelled with it. The labelled one sits in each tab's filter toolbar and clears that tab's three filters and nothing else. The other is the transport group's eject button, which carries no text at all and reads Reset only in its tooltip; it ends the session and empties three of the four lists — Shell, NC Diagnostics and Step Diagnostics. Only NC Manipulation is left standing, and the same is true of a project change: opening, reloading, creating or closing a project empties the same three and leaves that one alone. It is the list to read for what the last conversion or optimisation said, long after the run that produced it has been reset away.
The lists are the service's, not the browser's. They survive a reload, a move to another screen and a second tab opened on the same service, and two browsers watching the same run read the same four lists.
That is also what makes collapsing the panel harmless. Collapsing it takes it down entirely rather than hiding it, and all four connections drop with it. Nothing is lost, because nothing was being held here. What does not come back is the arrangement: re-expanding builds the panel fresh, on the first tab, with every tab's severity, category and text filters back at their defaults.
The service log
Show Log, near the right-hand end of the menu bar, opens the Log Viewer at /preference/log.
Its tooltip reads View the application log, and the page it opens is titled Log Viewer.
The viewer shows one file: the one the service is writing for the current day. There is no way to reach an earlier day's file from this page.
- Read the header row for what is on screen — the day the file covers, the time it was last fetched, and how many lines came back. The pane opens at the end of the file, which is where the newest lines are, and stays at the end through later fetches unless it has been scrolled away from the bottom.
- Press Refresh for a fresh copy, or switch Auto on and choose an interval — two, five, ten or thirty seconds — to have it re-fetched on its own.
- Take the text with Copy, or the whole file with Download. Both are unavailable while there is nothing loaded.
Switch Auto off before leaving the page. Moving to another screen does not stop it: the page is kept alive behind the one on screen and goes on re-fetching at its interval. Reloading the browser stops it, and so does a project change, because both rebuild the page area from scratch.
An empty file and a missing file look almost alike and are not the same thing. Both show No log file for today., and both hide the line count entirely — no count is drawn at all rather than one reading zero, so the caption simply being absent is itself the signal that nothing came back. The day badge is what separates them: when the file exists, the day comes from the service's own clock; when there is no file at all, it comes from the browser's clock in UTC, which need not name the same day.
A fetch that fails replaces the pane with the reason and a Retry button, and posts the reason to the footer under the viewer's own name — one of the few lines that reaches the footer without ever having been a toast.
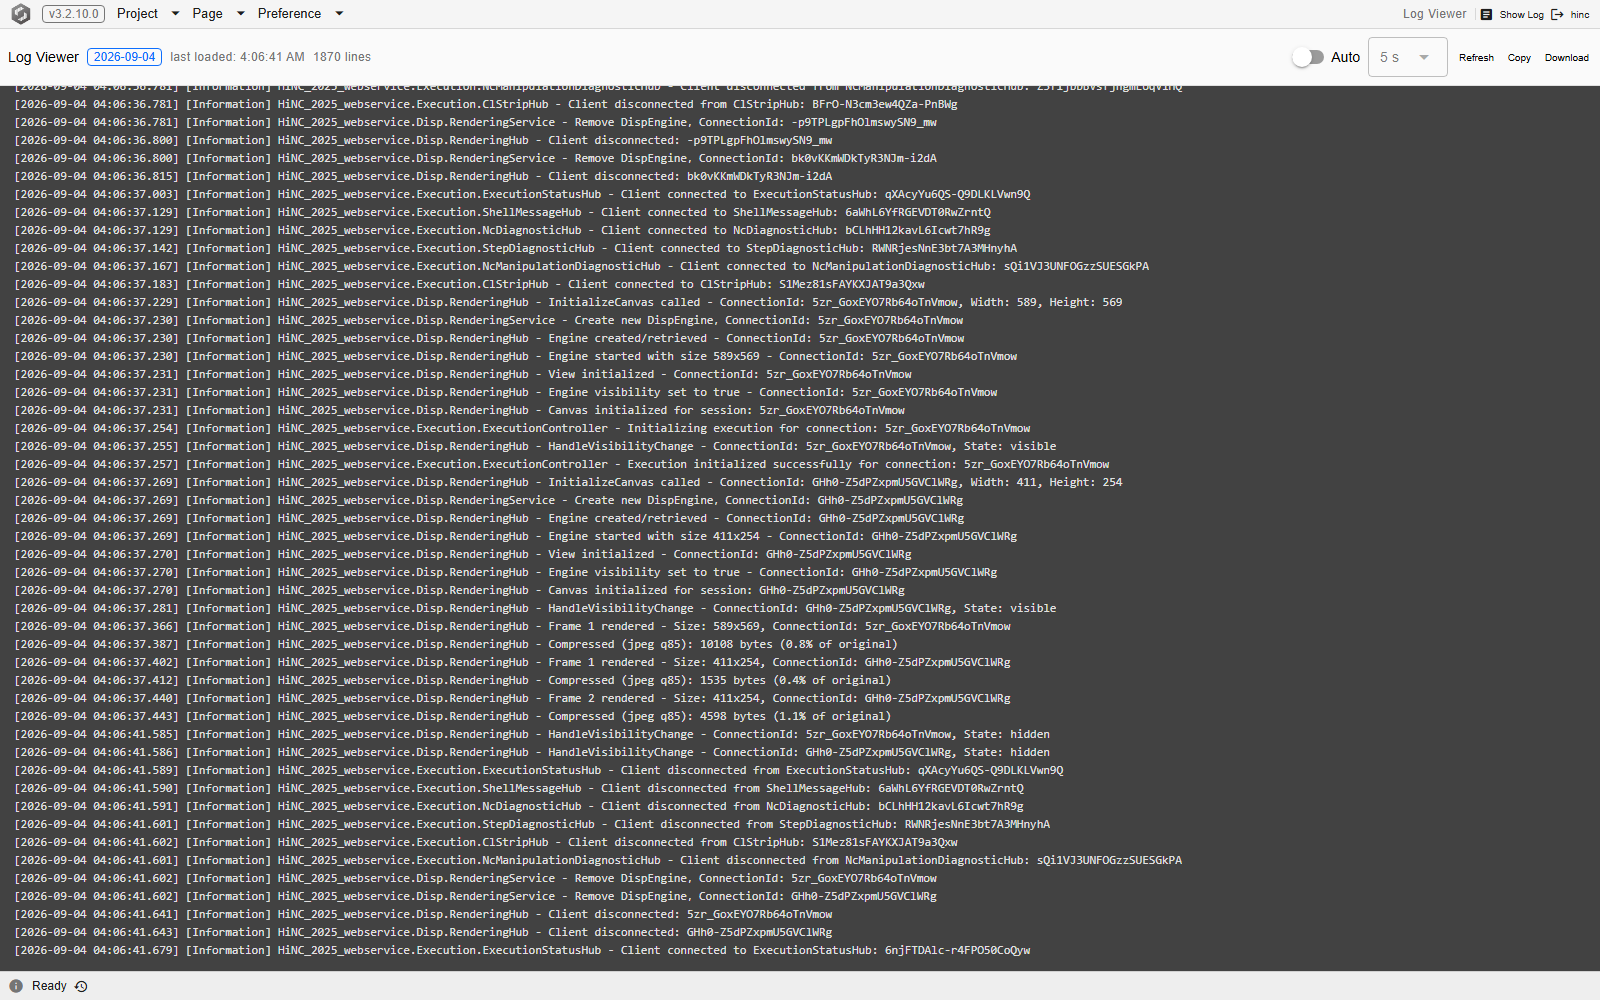
The Log Viewer at /preference/log, on a service that has been running for a while. The header
carries the page name, the day the file covers, when it was last loaded and its line count, then the
Auto toggle — off here — beside its interval, and Refresh, Copy and Download. The
lines in view are the service's own connection traffic for a whole screen: everything a page
connects — the four message tabs among them — arrives in one block and leaves in another once the
page is left, and most of what lies between is the rendering canvas being set up and reporting
frames.
This is the log of the service, not of the browser. A message seen in the footer reaches it only if the service also recorded it, and much of what it holds was never shown anywhere in the application.
Which surface answers which question
| To find out | Read |
|---|---|
| what the last action reported | the footer's latest line |
| what was reported while another screen was open | the recent list behind it — the only copy the window keeps |
| where a run has got to | the footer's session strip |
| whether one of the Project menu's operations is still running | the footer's background zone |
| what the session itself started, finished or refused | the Shell tab |
| why a program did not do what its text says | the NC Diagnostics tab |
| why a move behaved the way it did | the Step Diagnostics tab |
| what the last conversion or optimisation reported | the NC Manipulation tab, which a reset does not clear |
| why a project opened with pieces missing | the footer's recent list, or the Log Viewer — not the Session Messages panel |
| what the service recorded, shown or not | the Log Viewer |
See Also
- Basics — the rest of what is true on every screen
- The Application Window — the footer's three regions, and the menu bar Show Log sits on
- Preferences — the Preference menu that Show Log is not an entry of, and what else the service keeps for everyone on it
- Projects — the actions behind the footer's background zone, and what a project change clears
- When Something Goes Wrong — using these lists on a run that did not do what was expected