Watching the Run: the Strip Charts
The three strip charts of Watching the Run: what each plots, the group bar they share and its controls, the rows of tool IDs and file numbers above their plots, and a color tree drawn as one lane per leaf. Where the Session Info panel sits, the canvas, reading a chart with the pointer and the Breakage Probability tab are on that page.
The three strip charts
The three charts are tabs of the Session Info panel. One group bar drives whichever tab is open, and the three share one window and one selection, so a gesture on the open chart is there when you open either of the others. Each plots the whole mission rather than the current moment:
| Chart | What it plots |
|---|---|
| Availability Chart | Five ratios, in percent: stress, max spindle torque, max spindle power, spindle working temperature, thermal stress |
| Surface Roughness Chart | Re-cut depth, program-side cusp, and the change in tip deflection in X / Y / Z, in µm |
| Color Index Time Chart | One property you pick, from every step property the run can quantify |
Each series is drawn as a band between its minimum and its maximum, not as a line through samples: the window is downsampled to the width it has on screen, so what you are reading is the shape of the run — where the spindle is loaded, where surface quality degrades, where thermal limits are approached — rather than individual values. The values themselves are in the legend panel down the side of each chart, which follows the cursor and can be dragged wider. The properties whose value names something rather than measures it are drawn otherwise: Tool ID, FileNo, Stress Critical Zone and Stress Onset Zone as IDs, and a color tree's key as one lane per leaf; see Tool ID and FileNo and A color tree below.
A play with no spindle capability to read against — its file not read, none set, or one that gives no torque or power limit at any speed — has no spindle torque, power or temperature to draw: the Availability chart draws the stress and thermal stress ratios alone, the property picker leaves the spindle's quantities out, and Machining State has no spindle lanes (Without a spindle capability).
Every ratio reads in percent, wherever a chart shows one: Availability's five, and on the Color
Index chart a ratio — the stress ratio, a spindle ratio, the thermal stress ratio, a step variable
given a % unit (Step Variables) — or the breakage probability, as a
series or as a leaf's value band. The legend prints such a value with two decimals and the sign right
after the number, 82.35%; exactly zero as 0%; and a value above zero but under 0.01 % as
<0.01% (>-0.01% below zero), since a value that small needs no more digits; a band whose least
and greatest value both read <0.01% shows it once. Neither a series' name nor a leaf's value row
carries (%): the sign rides on every value. A series in percent ticks its axis in percent as well,
with no more decimals than the step between its ticks needs and never a step finer than 0.01 %, so
on Fit (auto) a breakage probability far under 0.01 % draws its line along the floor of an axis
from 0% to 0.01%.
The Surface Roughness chart plots the geometric and deflection contributions to the finished surface. It does not compute a roughness parameter such as Ra or Rz, and it has no series for the cusp left between neighbouring passes; see Surface Roughness Values. Its re-cut depth is how far the cutter's deflection moves the outer end of a flat end mill's bottom edge along the tool axis, so it is meaningful only for a flat end mill. It is a simplified, cheaper reading of the re-cut marks that the deflection transformation cuts into a floor's geometry (Reading the Difference at Several Visual Radii): one value per step, uniform over the whole step, so a stock coloured by it carries that value on every face the step was the last to cut — even on the side walls.
All three carry a Y-axis range editor on the group bar, in front of the controls they share,
behind a button that reads Auto
until you change it. Its three choices are Fit (auto), which follows the data; Lock, a Min
and Max you type, after which the button reads them as [min, max]; and Symmetric, about zero
with a ± bound you type, which the button shows as ±bound. On a chart in percent — Availability,
or the Color Index chart on a ratio or the breakage probability — the bounds are typed in percent,
% beside each field, and the button reads them so, [0%, 100%]. Locking one is how you compare two
parts of a run without the axis moving under you. The Color Index chart hides that button while it
plots Tool ID, FileNo, Stress Critical Zone, Stress Onset Zone or a color tree's key, and adds
two controls of its own: the property picker, which is a
type-to-filter list of every quantifiable step property in two groups — Engineering view, the
color trees, HiNC's built-in ones first, captioned Built-in
(Engineering View Coloring), and Science view, every other
property, each with its unit under its name: typing mm/min finds the feedrates and % the values
read in percent, the ratios and the breakage probability; a group the filter empties is left out, and Enter picks the first row shown — and Colors, which edits the colour guide. The machine coordinate of a wrap-around rotary axis picked there, MC.B for one, is drawn
between 0° and 360° as the controller's position screen shows it, so a table that keeps turning the
same way draws a sawtooth rather than a line that runs off the chart; the step file keeps the
continuous angle. Colors is worth understanding before you touch it: it drives the colour of the
workpiece in the 3D scene and the colour scale bar, not the line in the chart — and both of those
read the continuous angle the step file carries, not the folded one, so a colour range for MC.B
is set against −720° for two turns the same way, not against the chart's 0–360°. A ratio's colour
range, and the breakage probability's, is typed in percent, % beside its fields, and the colour
scale bar prints its two ends in percent; the project keeps a ratio's range as the ratio, 0 to 1 for
0 % to 100 %.
The group bar
| Control | What it does |
|---|---|
| Range chip | The slice of the mission currently shown, against its total step count (the strip's positions, the ones without a step included) |
| Cursor readout | The x-value under the pointer, shared by all three charts |
| X-axis mode | Time (s) or Step index, applied to all three at once. The plot prints the short form at the lower left, on the same line as the tick labels: Time (s) or Step |
| Fit view | Fits the 3D canvas to where the steps in the window cut — to their whole tool path when none of them cut, or to the home view when there is no tool path yet — the one control here that acts on the canvas |
| Stick to live end | On, the window's right edge follows the running end of the mission; off, it stays where it is while the run goes on |
| Reset display range | Back to the whole mission, and re-arms stick-to-end |
| Reload | Re-fetches all three charts |
When on, stick-to-end stays on through a zoom or a pan whose new window still reaches the running end — zooming out, or panning towards the end — and turns itself off the moment one stops the window short of the end, because that sets a definite right edge. That is the behaviour you want while a run is going — you can look at something without being dragged back to the live end — and Reset display range is how you re-arm it.
Switching it off fixes the window's right edge where it is, and the window stops growing with the run. That holds when you press it while the run is paused or finished, too: the right edge stays on the last step so far, and when the run goes on, the window stays put and the new steps are added past it. Until the run goes on, a zoom or a pan that leaves the right edge at the end — zooming out, zooming in at the right edge, or panning towards the end — keeps it fixed there, and the button stays off. Once the run has gone on past it, or a zoom or a pan has moved the right edge back from the end, the window is like any other that stops short of the end: bringing its right edge back onto the running end turns stick-to-end on again. Pressing the button again, or Reset display range, turns it back on.
Tool ID and FileNo
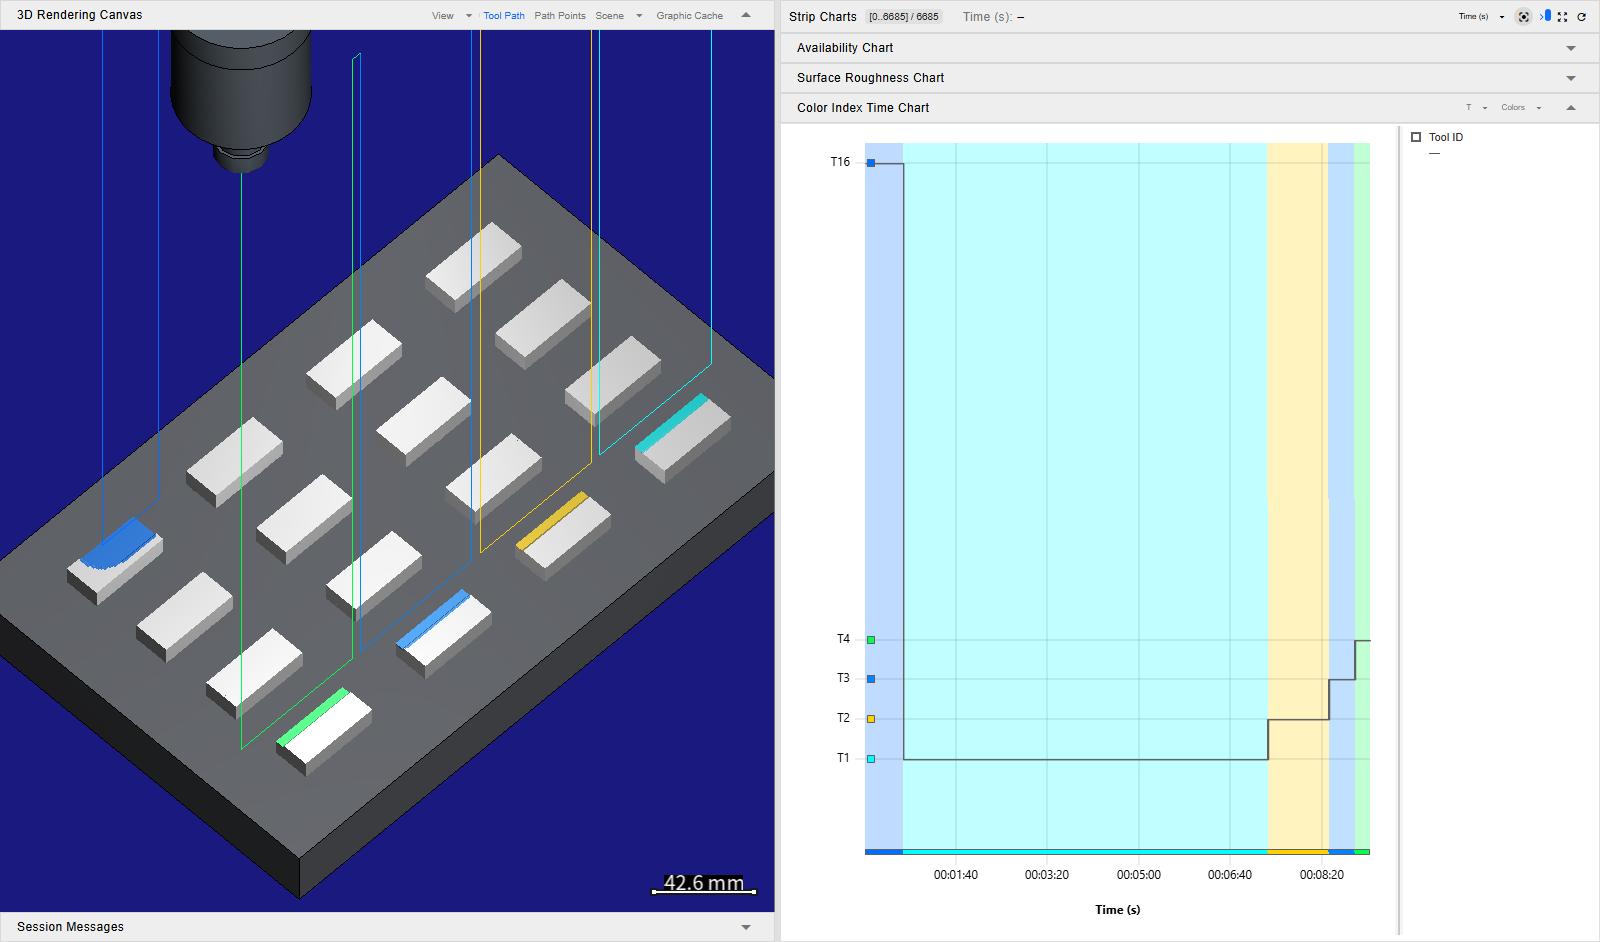
Tool ID is the tool in use during a step, cutting or not. FileNo numbers the program as it plays: each program file of the run takes the next number, and so does each subprogram or macro call — every repetition of a repeated call separately — and each jump inside a program, such as a GOTO or the next pass of a loop, so one file can carry many numbers. Both values name something rather than measure it, and picked in the Color Index chart either one is drawn as IDs:
- A grey staircase steps from one ID to the next. Each stretch of the run is tinted in its ID's colour, and a band in the same colours runs along the bottom of the plot.
- The Y axis lists only the IDs in the window —
T16,T1for tools, the bare number for FileNo — each with a swatch of its colour beside it. On a short chart some labels are left out so that they do not overlap, and their colours still show in the band. Pointing at a label, or at the swatch beside it, shows that ID's name, and so does a label the axis left out. Where one pixel column of the chart holds several IDs, only the lowest and the highest of them reach the axis, the tint and the band; zoom in to see the ones between. - The legend reads the ID under the pointer,
T3, or the lowest and highest,T1 ~ T3, where one pixel column holds more than one.
The 3D scene takes the same colours: every cut face and every stretch of the tool path is in the colour of its step's ID, and the swatches on the Y axis are the key, since the canvas draws none of its own. A tool ID or a file number keeps its colour — T3 is the same colour in every program and every run — and IDs next to each other get colours far apart. Some IDs further apart come out close — those 5, 8, 13 or 21 apart, as T3 and T16 do below, both blue — and from ID 378 on, two IDs can even share a colour; the Y axis tells them apart. No tool ID or file number is ever red or close to it, since the scene uses red for collisions, and none is a deep blue that would vanish against the canvas background. Colors has no range to set for these two — it reads This guide has no editable range. — and the colour scale bar is not drawn while either of them colours the scene, even with Color Scale Bar ticked under Scene.
Whatever a chart plots, the tool and the file number can also run as rows of IDs above its plot, so that a stress peak or a roughness band reads against the tool that was cutting there. The last tab of the Session Info panel, Panel Layout, has two boxes for them on one line under the chart boxes of its Strip charts block, after Above the plots: Tool ID, ticked until you untick it, and File No, unticked until you tick it. One pair sets all three charts, and this browser keeps it for your next visit; another browser, or another computer, keeps its own.
- Each stretch of the run with one tool is a segment of the Tool ID row, its tool written in the
middle,
T13; segments side by side take turns between two light greys, and one too narrow for its name shows the grey alone. The File No row does the same with the file numbers, written bare. While the run plays on, a segment keeps its grey. - Where one pixel column of the chart holds a change of tool, the row draws a darker grey divider there, which belongs to neither segment; zoom in to see the stretch between. A tool used too briefly to take a pixel column of its own can leave two segments of one grey side by side; a thin line parts them.
- Each row's name, Tool ID or File No, stands at its left, beside the Y axis. With both ticked, the File No row is the upper one and the Tool ID row stays next to the plot.
- The rows take nothing from the plot: each one ticked adds a line to the chart's height, and the Session Info panel's least height grows with it.
File No starts off because a file number is not one fixed number for the main program and one for each subprogram: as above, every call, every repetition and every jump takes a new one, so a program that calls subprograms often cuts the File No row into many slivers. Tick it to see where each called program, or each pass of a loop, ran.
A run that cut with five tools, T16 first and then T1 to T4, with Tool ID picked on the Color Index tab, the canvas in the Isometric view and fitted with Fit view, which frames the cuts, and Tool ticked under Scene so the tool and its holder are drawn. Availability and Surface Roughness are the neighbouring tabs.
Stress Critical Zone and Stress Onset Zone name something as well: the part of the cutter where a step's stress ratio is highest, and where it first goes over 100 % counted from the tip — Flute, Taper or Cylinder, and None for a step with no such part; how to read them is in Evaluating Process Machinability. Picked in the Color Index chart, either one is drawn as IDs in the same way, its Y axis and legend naming the zones instead of numbering them, and the 3D scene takes the same colours. As for the two above, Colors has no range to set and the colour scale bar is not drawn.
A color tree
A color tree — one the project defines on the Step Colors root of the Control Tree
(Step Colors), one a mission script registers (RegisterStepColorTree, see
Step), or one of the two HiNC builds in
(Engineering View Coloring) — sorts the steps into leaves by
conditions on their properties; how a tree sorts them is in
Color Trees. Its value on a step is the number of
the leaf the step falls into, and picked in the Color Index chart — or made the color index with
Set as color index on its panel — it is drawn in lanes:
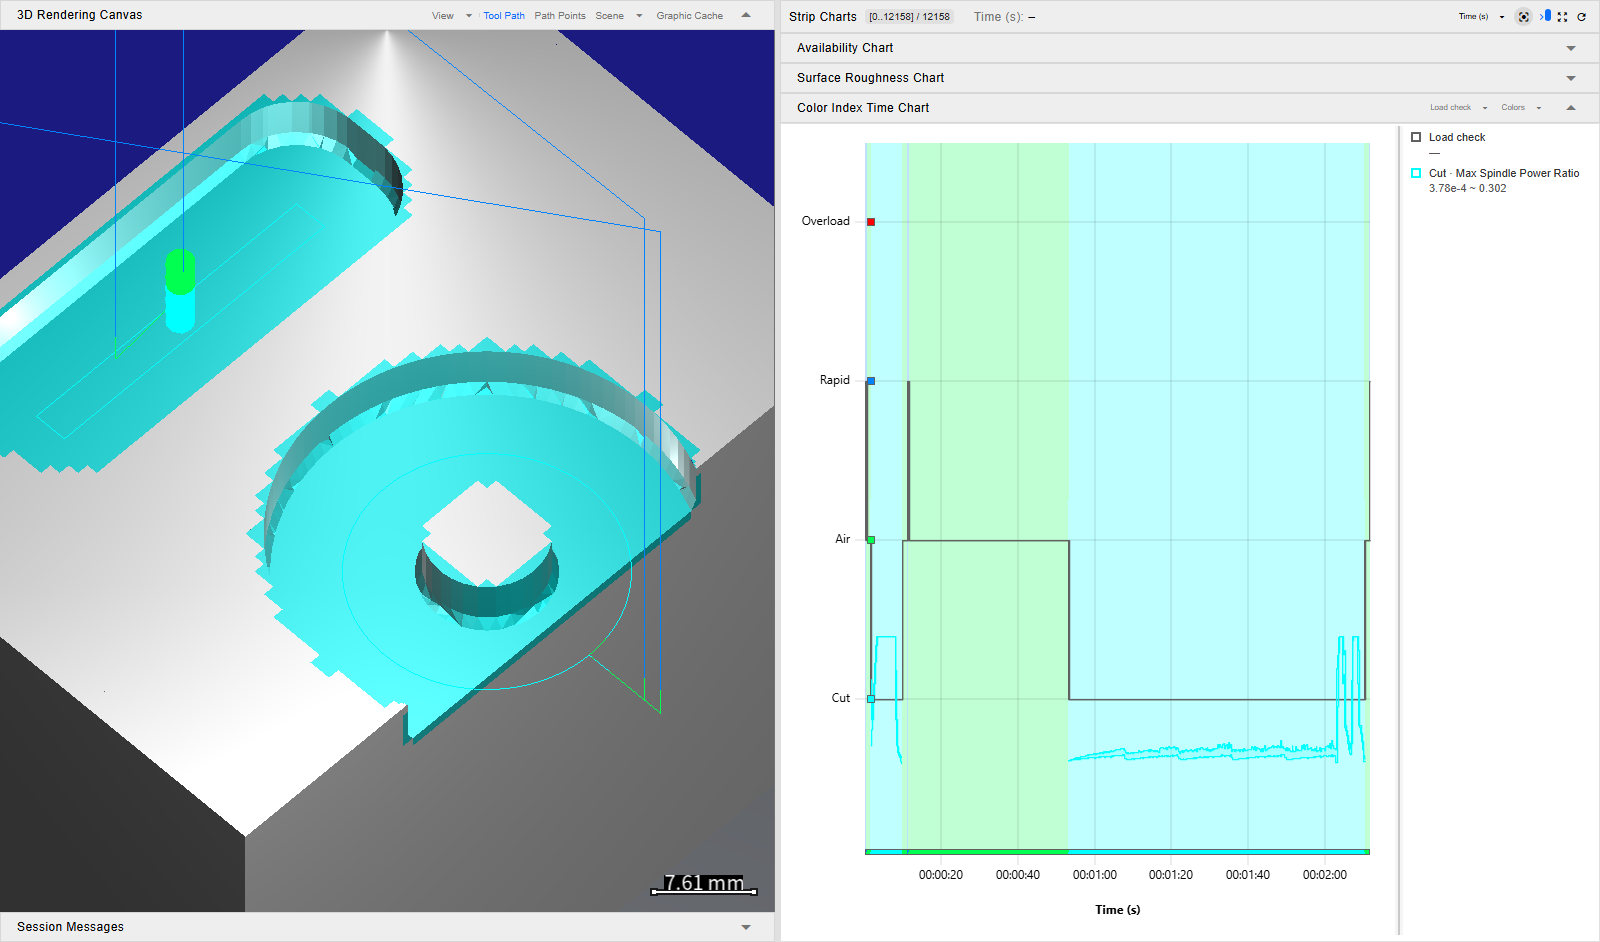
- One lane per leaf, the tree's first leaf at the top. A lane is the cell between two of the plot's horizontal grid lines: the lines lie on the borders between the lanes, with one under the lowest lane and the plot's top edge over the highest, and none runs through a lane's middle, where the lane's name and swatch stand on the axis. Every lane is drawn whether or not a step of the window fell into its leaf, so the axis never rescales while the run plays, and an empty lane is an answer too; only a leaf left out of the tree in a play without a spindle capability has none. Each stretch is tinted in its leaf's colour, a band in the same colours runs along the bottom of the plot, as for a tool ID, and a translucent grey bar fills the whole cell of the stretch's lane, and of every other lane whose state holds on the same steps (below), the tint still showing through it, with nothing joining a lane's bar to another lane's.
- The Y axis names each lane by its leaf's short name — the leaf's name when it has no short name, an unnamed leaf by its number — beside a swatch of its colour. A label still too long for the axis is cut short with an ellipsis (…). Pointing at the label, or at the swatch beside it, shows the leaf's full name, and so does a lane whose label the axis left out. The legend and Colors give the full name as well. Up to fourteen lanes the chart is tall enough for every label; with more, a label without room is left out, as on a short ID chart, and its lane keeps its two grid lines.
- A pixel column that holds steps of several leaves shows the most important of them alone: the leaf highest in the tree, the top lane among them. Its tint and its piece of the band are that leaf's colour from top to bottom, and the grey bar fills that leaf's lane and the lanes of the states that hold on its steps; a leaf under it shows once a zoom gives its steps pixel columns of their own. The tree's order is the leaves' importance, so in Machining State a column that holds one Collision step shows Collision.
- Several states at once. A step falls into one leaf, the first whose condition holds, and further down the tree other leaves can hold on it too: a leaf holds on a step when its own condition holds and so does the condition of every group above it, whichever leaf took the step. A leaf without a condition, a list's Otherwise, holds only on the steps it takes, and no node after it in its list holds at all. A pixel column bars the lane of the leaf it shows and the lane of every leaf that holds on that leaf's steps, all in the one grey; the tint and the band stay the shown leaf's colour, which names the most important state. So a cut over its stress limit whose spindle also runs too hot bars Stress overload, High breakage probability beside it, and Spindle overheat in Machining State, tinted in Stress overload's colour. A leaf that holds only on the steps of a less important leaf sharing the column is not barred there. Only the bars count the states that hold: the step's own leaf is still the one the 3D view paints, Step Properties and the step file name, Colors counts, and a click selects by.
- A leaf that shows a value — one given a Value shown on the time chart on its panel — carries a band of that value inside its own lane, in its colour, from the least to the greatest value in each pixel column that bars its lane: of the steps it takes where the column shows it, and of the shown leaf's steps on which it holds. The band is scaled to the leaf's own range in the window and stays between the lane's two grid lines, its least value a little above the lower line and its greatest a little below the upper, so its numbers are read in the legend; an overload, an infinite value, sits at that upper limit, and a column that does not bar the lane leaves a gap. Clicking the tree's row off in the legend hides the bars, not the bands. No band is drawn for a physics value while Preference › Show Physics Options is off.
- Two leaves on one condition. A leaf on the very condition of an earlier leaf of its list takes no step (Step Colors) and holds wherever that leaf holds: no stretch of the tint is its own, but its lane is barred beside the earlier leaf's, and the band of its value is drawn there. Machining State draws High breakage probability so, right under Stress overload, over the same steps (Reading the Load Leaves).
- A lane name ending in ? The chart reads whether a leaf also holds, and its value there, without going to the step cache. Where a condition or a value can be read only from the step cache on some step of the display range — a step variable a mission script writes onto the steps, for example — or its read fails, the lane's name ends in ?, and pointing at it adds a sentence saying so: the lane may lack a bar or a stretch of its band on those steps. The two built-in trees never show it.
- The legend's row of the tree lists the states the pixel column under the pointer bars, most
important first, by their short names joined by " / " —
Stress over / Overheat—, with their full names in the row's tooltip, and — over a column without a leaf; a leaf on the very condition of an earlier leaf is left out of the list where that leaf is in it, its bar still drawn. Each leaf that shows a value has a row of its own, such asCut · Max Spindle Power Ratio, with the least and greatest value in that column, — over a column that does not bar its lane (High breakage probability reads wherever Stress overload is barred), or, when the pointer is off the chart, the range over the window of the values the chart reads for the lane: the chart reads the window in short stretches, about a pixel column wide, and in each it takes the values on the steps of that stretch's most important leaf on which the leaf holds, so a step of the leaf that shares its stretch with a more important leaf, on whose steps it does not hold, adds nothing, though Colors counts it. A zone's value reads by its name,Flute, orFlute ~ Cylinderwhen the least and the greatest differ. A value leaf's row is listed only while the chart reads a value of it in the window — on an ordinary cut, Stress overload, High breakage probability and the spindle overload leaves are absent — while the tree's own row stays, and the lanes do not change.
A window in which no step fell into a leaf — a tree without a leaf that takes every step, or a stretch none of its leaves takes — shows its empty lanes rather than No physics data. The tint, the band, the swatches and the 3D scene take the colour the tree gives each leaf, which can be any colour, red included; a leaf given no hue takes the colour its number has as an ID. A step that falls into no leaf is a gap in the chart and pale green in the 3D scene, the colour of a step without a value, and the colour scale bar is not drawn.
Colors shows the tree in place of a colour range: Color tree: with the tree's name,
In the display range, and a table of the leaves in the tree's order — each with its colour, its
name, its Steps and its Time share in the display range, a share printed as every percent
is, with two decimals, 0% for none and <0.01% for a sliver under 0.01 % — and a No value row when some
steps fell into no leaf. In Machining State, Stress overload and High breakage
probability stand one under the other; their shares are of the same drawn time, those steps counted
once, and they read the same when every one of those steps has a probability
(Reading the Load Leaves). Until the
chart has read every step's value, the counts read —. A play stopped part way leaves the
positions of the steps the stop dropped — usually up to 122, more when the stages after the
cutting have fallen behind — outside Steps and Time share: they
hold no step and read as a gap in the chart; the range chip's total counts them, so the two totals
differ by that many. Under
the table, Edit color tree → opens the tree's panel on the Step Colors root; a tree a script
registered has no panel, and reads Registered at run, read-only instead. A built-in tree reads
Built-in, read-only, with Copy to project tree…, which copies it into the project's trees and
opens the copy's panel; above its table it lists what the leaves cannot show about the steps since the
last reset — collision detection that was off or ran without a collision licence, steps from a CSV
program, a recorded play under review, and for Machining State the physics switched off, the
spindle capability the ratios are read against, or that there is none, and the tools whose stress
ratio could not be evaluated (Reading the Notes). A project's tree or a
script's lists nothing there, but for one line in a play without a spindle capability, when the
spindle's quantities changed the tree. While the
physics options are hidden and the color index is Machining State, the chart draws Machining
State (No Physics) in its place, and Colors keeps the full tree, the 3D view's.
The run pictured on Step Colors, at /execution, with that page's example tree, Load check,
as the color index: four leaves, Overload, Rapid, Air and Cut from the top, Cut showing the max
spindle power ratio. The Color Index tab is open. The canvas is in the Isometric view and
fitted with Fit view. These leaves have no short name, so the lanes print their names. Air's
condition, Is Touched is no, holds on a rapid that touches nothing as well, so each thin rapid
stretch bars Rapid and Air.
See Also
- Watching the Run — the page these charts belong to: where the Session Info panel sits, the canvas, reading a chart with the pointer and the Breakage Probability tab
- Step Variables — your own values of each step, which the strip charts plot and colour by
- Step Colors — the color trees, whose key the Color Index Time Chart draws as a lane per leaf, and the panel Edit color tree → opens
- Engineering View Coloring — HiNC's built-in trees at the top of the picker's Engineering view, the notes their Colors dropdown lists, and the stand-in while the physics is hidden