Inspecting a Step
Once a strip chart has told you where, the Step Info column tells you what. Every panel in it is a view of the one selected step — except the panel at the top, which deliberately is not, and the reason for that exception is worth knowing before you read the column.
Where it is
The Execution page at /execution, rightmost column, switched on and off from the quick-toggles on
the menu bar. Most of it stays empty until a step is selected, and selecting one is a click on a
strip chart or on the tool path in the 3D canvas.
Sentence Syntax, and why it sits outside
The top panel is the odd one out, and it is placed outside the step group on purpose: a line of NC need not produce a machining step at all. A tool change, a coordinate selection or a comment is a sentence with no motion under it, so a panel that reads sentences cannot be a member of a group keyed on steps.
It shows the sentence's own text and the reading the interpreter made of it, with a badge naming the file, the line and the sentence, and a button that copies the parsed form.
Its two empty messages say different things, and the difference matters:
- No sentence selected — nothing is picked yet.
- This line has no executed SyntaxPiece — a line is picked, and it did not run in this session. That is an answer, not a gap: the line was skipped, or it belongs to a pass the run never reached, or the session has been reset since.
The sentence it follows comes from two directions: selecting a step brings its sentence here, and so does clicking a line in a Program file panel. That is the bridge between reading the program and reading the run.
The rest of the column
Below the group bar every panel is a view of the same selected step.
| Panel | What it shows |
|---|---|
| Step Properties | The step's values, for the fields you have chosen |
| CWE | The cutter–workpiece engagement — what the cutter was actually touching |
| Sim Cutting Force Cycle | Simulated cutting force through one spindle revolution |
| Sim Spindle Moment Cycle | Simulated spindle moment through the same revolution |
| Sensor Cutting Force Cycle | The same force as measured by a dynamometer, against time |
| Sensor Spindle Moment Cycle | The same moment as measured, against time |
The group bar above them carries the step number as a badge, or No step selected. That badge is the only place the step index is shown — Step Properties leaves that row out rather than repeat it, which is why the list you configure and the list you see differ by one row.
Step Properties shows short names. Hovering a name gives the full one, and the unit follows the
value. A field with nothing in it reads -.
CWE is a footprint, not a solid. It is a small 3D view of its own, drawing the contact contours the step left behind rather than the volume it swept, because contours are what a step stores. It has its own view controls and a contour-grid toggle, and it reads No cut in this step for a step that removed nothing — a rapid, or a move in air.
Two scales, and the join between them
The strip charts beside this column and the cycle charts inside it are the same measurements at two scales: the strip charts span the whole mission, the cycle charts span one revolution of one step. Changing the selection on a strip chart re-reads every cycle chart, so scrubbing the mission scrubs the detail with it.
The two simulated charts plot against spindle angle in degrees; the two sensor charts plot against time in seconds, because measured data arrives on a clock rather than on a phase. Both sensor charts need measurement data attached to the project; with none, they read No data for step while the simulated pair beside them is full.
Each cycle chart's header carries a value boundary — Auto, or a fixed ± bound that pins the scale so two steps can be compared without the axis moving under you — and a reload. The two spindle moment charts carry one more: a Line / Dartboard switch, where Dartboard replots the same cycle as a locus in the plane instead of three channels against the cycle parameter.
Clicking a point in a cycle chart marks that point for its whole group. The two simulated charts share one mark in spindle angle; the two sensor charts share another in seconds. The mark survives a switch between Line and Dartboard and a change of selected step. It also reaches the CWE panel: the cutter in that view rotates to the angle you clicked, so “the force peaked here” and “this is what the cutter was touching there” become one picture rather than two.
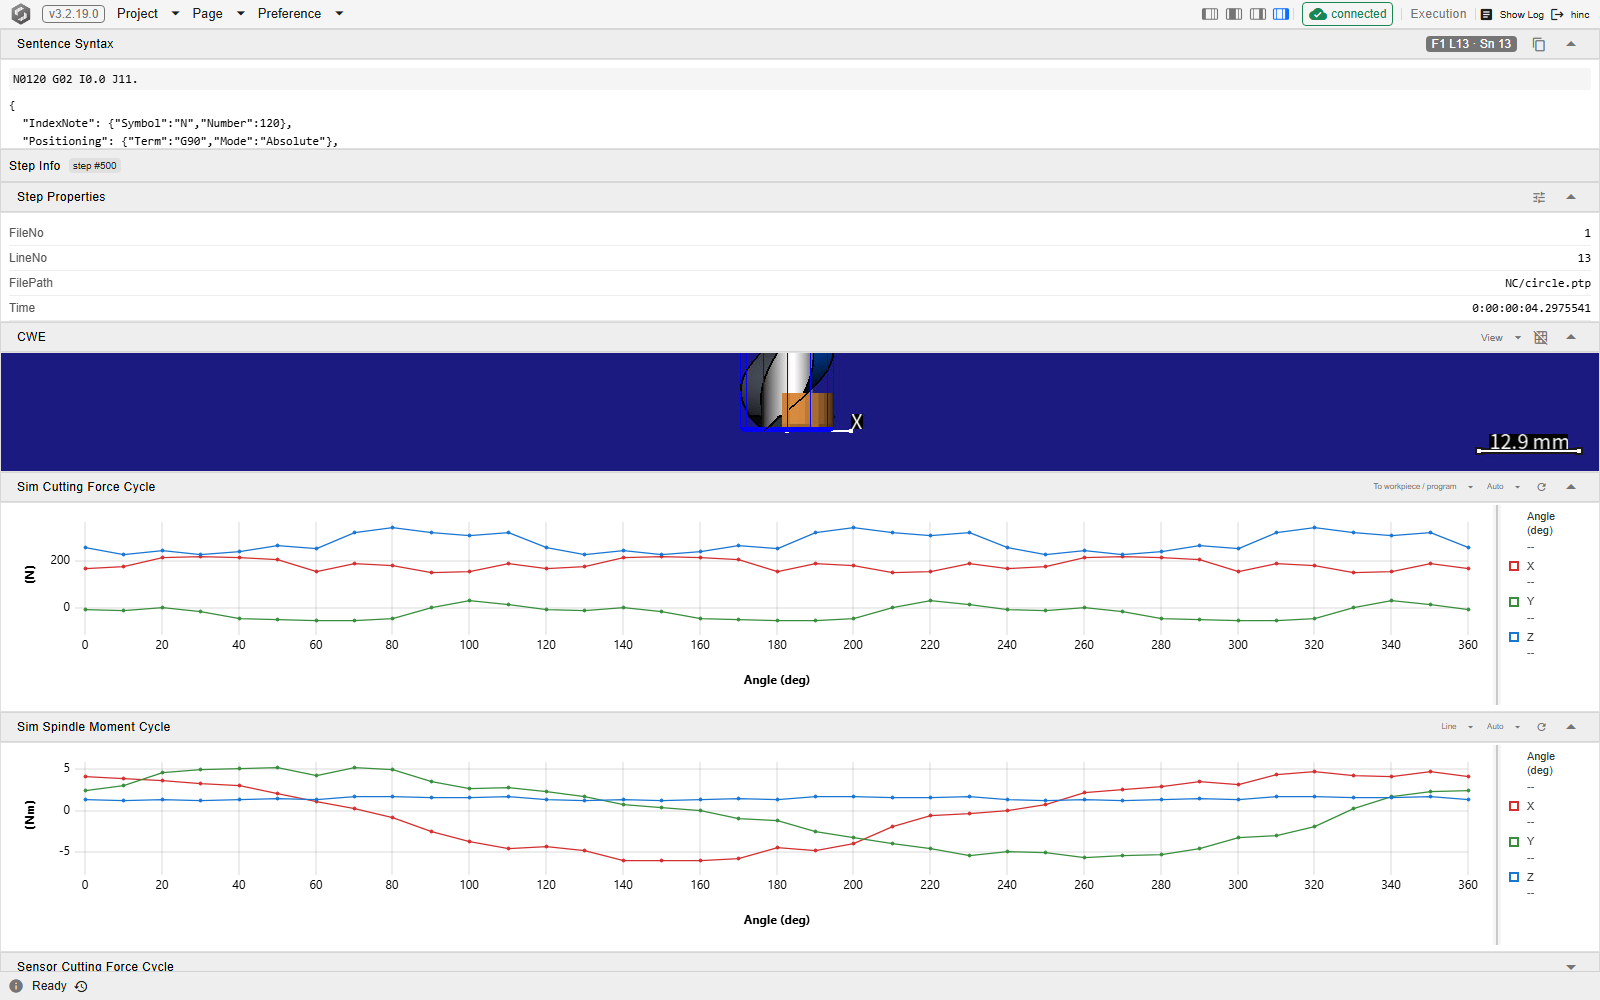
The column with the demo mission paused and a step selected: Sentence Syntax at the top, the step badge on the bar below it, then Step Properties, CWE and the two simulated cycle charts. The two sensor charts are folded away at the bottom — this project carries no measured data, so nothing is lost by leaving them shut.
Choosing what Step Properties shows
Step Properties does not show everything a step carries — it shows what you asked for, out of a much longer list. The small button on that panel's header opens the chooser, beside the list it configures.
Candidates are on the left, grouped into categories; a category header ticks or unticks the whole group, and Add Selected moves what you ticked across. Anything already displayed is greyed with a tick beside it, so the left side never offers you a duplicate. The displayed list is on the right, in the order it will appear: drag a row, or use its up and down buttons, and remove one row at a time or Clear the lot. Reset empties the list entirely.
There is no Save button, and that is not an omission. Every add, removal and reorder is written as you make it, and the header reports the write — so the way to undo an experiment is to put the rows back, not to close the dialog.
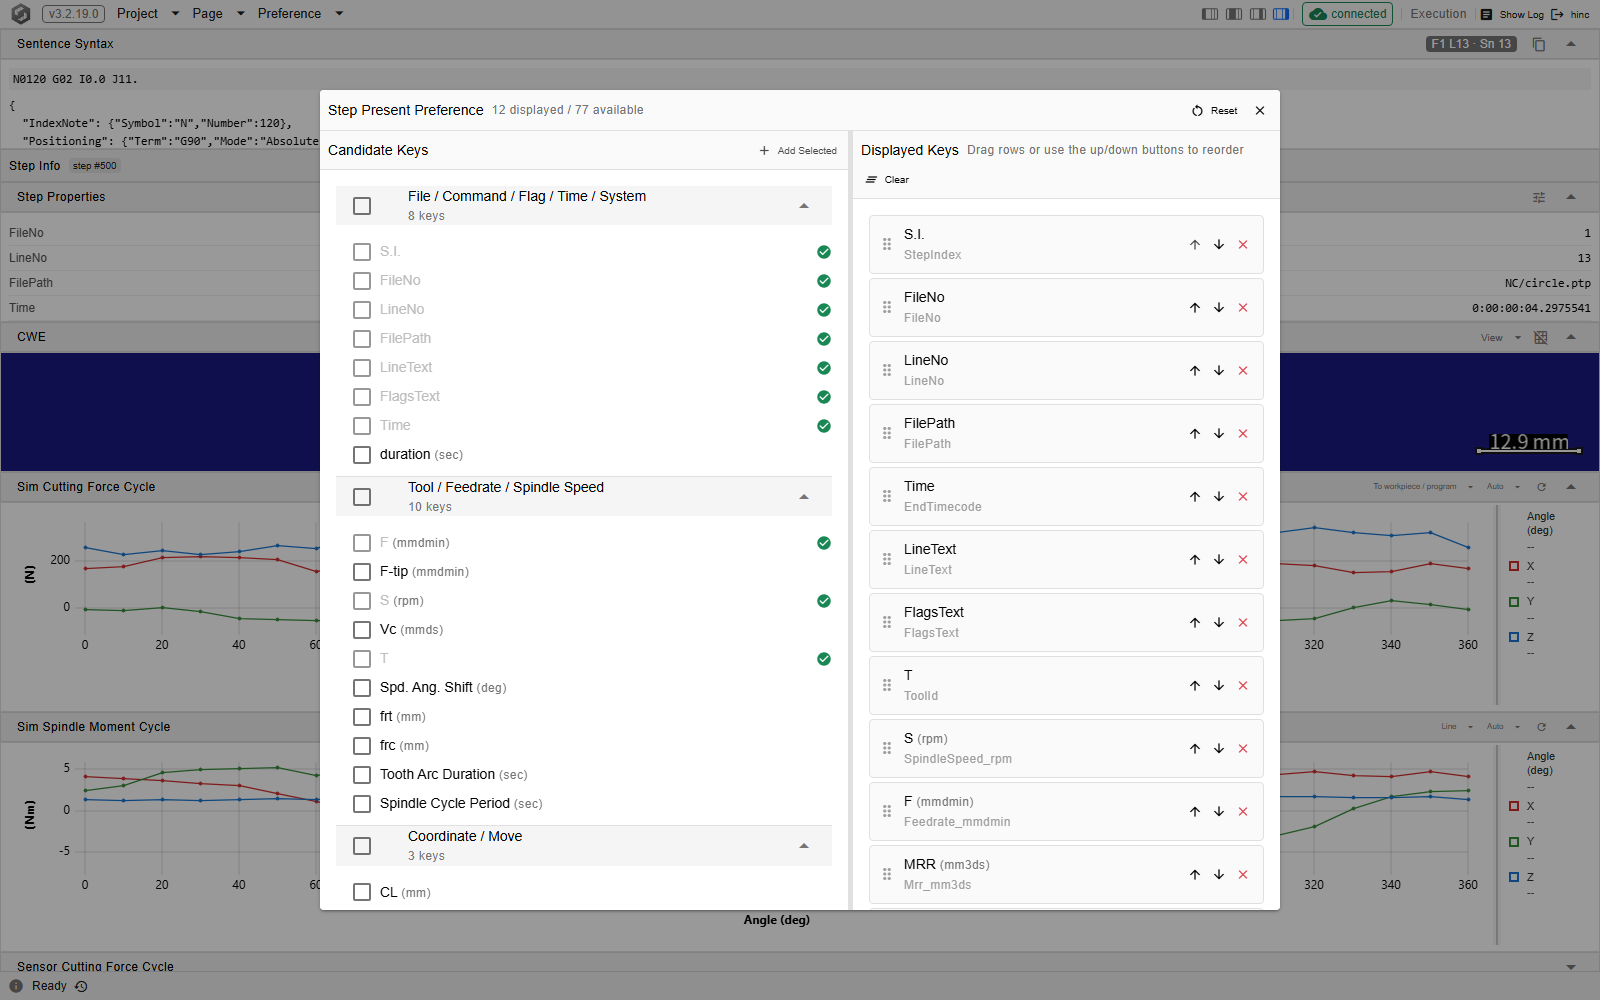
The chooser open over the column, at /execution. The counts in its header are this account's
displayed list against everything the run can offer; the green ticks down the candidate side are the
rows already on the right.
See Also
- Running a Simulation — the rest of running a job
- Watching the Run — the mission-wide charts whose selection fills this column
- Starting and Stepping — stepping the run to land on the step you want to read
- The Program Branch — the file panels whose line clicks steer the Sentence Syntax panel
- Selected-Step Info Panel — the component behind Step Properties, and where its values come from
- Cycle-Line Charts — the components behind the four cycle charts, and the shared cursor mark
- Step Present Dialog — the component behind the chooser: its categories, its labels and how it persists