CAM Floating-Point Drift Triggers Floor-Contact Force Peaks
Layered (Z-stepped) cuts can produce force peaks that look like simulation bugs but reflect a real physical sensitivity: sub-micron contact between the cutter bottom face and the previous-layer floor produces a large force difference, and CAM-generated NC programs often drift between layers by similar amounts on whichever axis carries the repeated path. This coupling between CAM floating-point drift and sub-micron floor sensitivity is rarely recognized in typical workflows; HiNC surfaces and diagnoses it through smart-tool-holder validation and force-simulation comparison.
See also NC Optimization and Corner Feedrate Behavior.
Phenomenon
In a Z-stepped uniform cut, one or two specific layers occasionally show a sharp force spike. In the example below, the X-direction force peak reaches ~865 N where adjacent layers stay near a ~477 N steady level on a D16 mm cutter in aluminum. Users often interpret this as a simulation anomaly because the NC optimizer slows the feedrate dramatically at the spike.
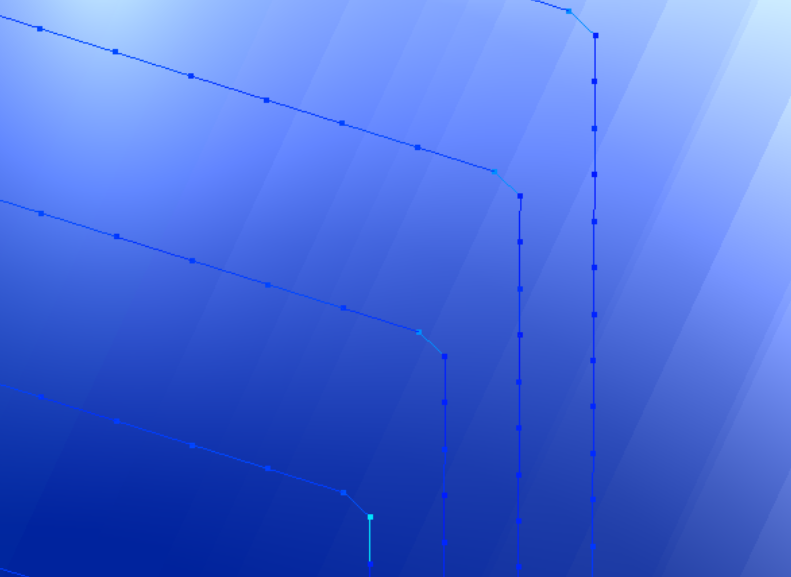 Schematic of a Z-stepped layered cut. Each horizontal trace is one layer; sub-thousandth-mm in-plane drift between layers (Y in this example) shifts where each layer enters and exits the previous-layer floor.
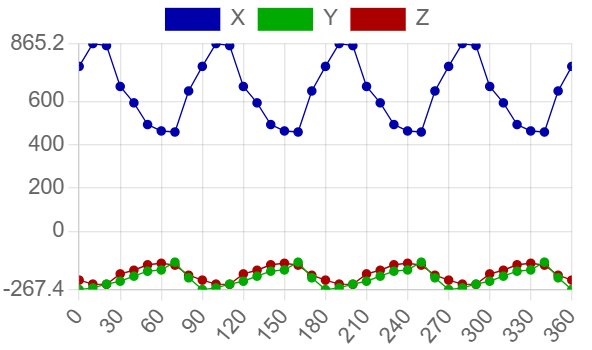 Spike layer that contacts the previous-layer ridge — X peaks reach ~865 N.
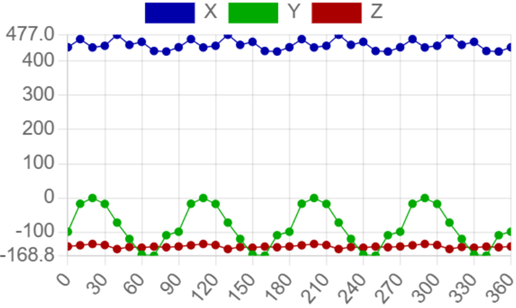 Adjacent normal layer at the “same” XY — X stays near ~477 N.
Mechanism
Smart-tool-holder measurements show that the cutter bottom face is sensitive to sub-micron contact with the previous-layer floor:
- A gap of less than 1 μm already produces a measurable force difference.
- Below the minimum effective chip thickness — 7.5 μm in this example, and in general varying with workpiece material and cutter edge geometry — no chip is formed, but friction on the cutter's lower contact band still loads the spindle.
- In simulation, modeling the cutter floor as lifted by 0.15 μm versus not lifted yields visibly different spindle-torque waveforms — and only the lifted version matches the real smart-holder torque shape.
Simulation force peaks driven by floor contact therefore reflect a real sensitivity, not a numerical artifact.
NC-Side Trigger: Layer-to-Layer Drift
CAM-generated NC programs frequently drift by ~0.001 mm between consecutive Z layers when they traverse the “same” position. In the example below, the drift falls on Y; in other programs it may fall on X or any in-plane axis along the repeated path.
N1000 G01 Y10.001   (layers 1..4)
N1100 G01 Y10.002   (layer 5)
N…    G01 Y10.005   (last layer)
Each layer lands at a slightly different position relative to the previous floor. Some layers contact the leftover ridge from the layer above; others miss it. The contacting layers exhibit the peak.
Why the Simulation Peak Is Real
The simulation force model simplifies how the cutter upper portion engages when the gap is below the minimum effective chip thickness, so the simulated peak may be slightly larger than the real peak. For ductile materials (aluminum being a representative case), friction dominates the cutting force, so the overestimate is small.
The actual machine has independent safety margins: the controller decelerates at corners (see Corner Feedrate Behavior), and cutter rotation provides a flute-level Probabilistic Peak Dodging effect.
In the example above, the cutter remains inside its safe limits at the spike peak (~865 N versus the ~477 N baseline). Harder materials would be more prone to flute breakage at the same NC, but the fix is the same.
Probabilistic Peak Dodging
For a multi-flute cutter, whether a contacting layer actually produces a peak depends on the flute phase at the contact moment. Force samples within one flute period typically split into:
- ~6 samples in the high-force window (e.g., above ~500 N in the spike-layer chart above)
- ~3 samples low enough to “miss” the spike
i.e., ~2/3 fall in the high-force window and ~1/3 miss it. This is why neighboring layers can give different results despite nominally identical geometry. It also explains why the issue is a yield problem rather than a deterministic failure — and why peaks still appear after fixing some, but not all, of the drifting NC lines.
Mitigation: Fix the NC
Clean up the NC program rather than tune the simulation:
- Identify the drifting positions (typically a few dozen lines in a layered pocket) and snap the drifting coordinate to a consistent value across layers.
- This restores a clean floor-to-floor relationship and removes the spurious peaks.
Tuning the simulation around the peak would mask a signal that the controller and the cutter both feel in practice.
When the NC Cannot Be Modified
For mature client products the NC is often a frozen standard, and the floor-contact peaks have to be accepted on the simulation side. Two optimizer-side levers absorb the peaks without modifying the NC:
MinFeedPerTooth_mm (API) — a floor on the optimizer's chosen feed-per-tooth. Set it to a scaled fraction of the original feed so the optimizer cannot slow further at a single-revolution spike:
MachiningStepBuilt += (preStep, curStep) =>
{
    curStep.UpdateNcOptOption(opt =>
    {
        opt.MinFeedPerTooth_mm = FeedPerTooth_mm * scale;
    });
};
OptYieldingUtilizationFactor (API) — raise the acceptance threshold for the yield-stress ratio based on the observed stable extreme (e.g., if 150 % is routinely tolerated, set
1.5). See Tuning Peak Tolerance for the full set of per-metric factors and which can be relaxed.
Prefer these over modifying cutting coefficients to suppress peaks. The coefficients describe material behaviour; tuning them away from physical values masks the real signal for every downstream calculation (force, moment, wear, thermal).
Note
The current API does not filter single-revolution spikes out of the optimization basis. If a client policy requires excluding such spikes, apply the levers above at the MachiningStepBuilt (API) callback so per-step settings can be overridden without disturbing the global option.
See Also
- Probabilistic Peak & Cutter Crack — The general statement of the probabilistic peak effect this section describes
- Corner Feedrate Behavior — Force-peak interaction with controller deceleration at corners
- Smart Holder Training — Smart tool holder measurement that confirms sub-micron sensitivity
- Relief Face Avoidance — Related geometry sensitivity on the relief side