Optimized Feed Rate at Corners Is Lower Than Empirically Feasible
See also NC Optimization and the script command Workflow: NC Optimization.
Phenomenon
During NC feed rate optimization, corners often exhibit significant feed rate reductions — sometimes even lower than what is empirically known to be feasible. This puzzles users: actual machining at corners doesn't require such drastic reductions, so why does the optimization produce these results?
Controller Deceleration at Corners
At corners, the controller automatically decelerates at high speeds. This is a built-in controller behavior as well as a hardware limitation, designed to ensure the machine can safely and accurately complete direction changes. The controller also provides parameters to adjust this acceleration/deceleration behavior.
Relationship Between Buffer Distance and Speed
The higher the speed, the longer the required buffer distance. The figure below shows machining conditions for several straight-line paths:
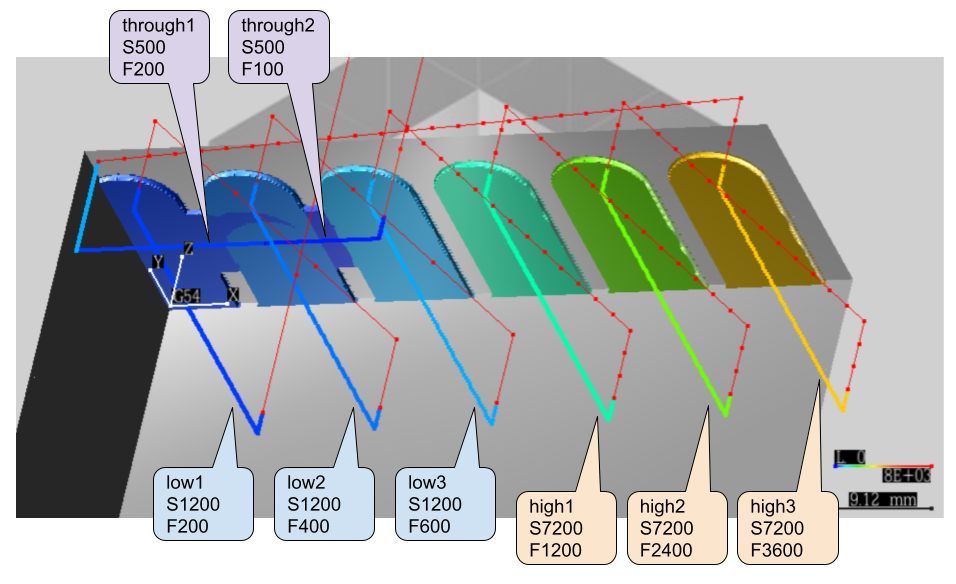
The figure labels the spindle speed (S) and feed rate (F) settings for different segments:
- through1/through2: S500, F200/F100
- low1/low2/low3: S1200, F200/F400/F600
- high1/high2/high3: S7200, F1200/F2400/F3600
Why Corners Produce Force Peaks
Independently of feed-rate optimization, corners themselves generate force peaks that can be 3–4× the straight-line steady force. The mechanism is geometric:
- Contact area grows at the corner. Two cut segments share the corner's swept volume, so during the turn the engaged arc on the cutter exceeds the steady-state arc.
- Friction force scales with contact area. For ductile materials (aluminum, nickel) friction is a large share of the cutting force, so the area increase translates directly into a torque/force peak. Both bending moment and torque feel it.
- CAM can amplify the contact area. Layer-to-layer drift or imperfect corner alignment in CAM-generated NC leaves residual ridges that increase the corner sweep on subsequent layers; the peak then reflects both the geometric corner effect and the CAM-side drift. See CAM Floating-Point Drift for the floor-contact mechanism that compounds with this.
- Peaks are expected, not artifacts. As long as the corner geometry is correctly aligned, peaks will appear in simulation; absent them, suspect a misalignment.
A peak contained inside a single revolution is itself a partial safety margin — controller corner smoothing and spindle inertia together absorb a single-rev overshoot. Sustained peaks across multiple revolutions are a different story: they drag the spindle below commanded rpm and compound through feed-per-tooth growth. See Tuning Peak Tolerance for which metrics can be relaxed in response and which cannot.
Force Simulation Error Analysis
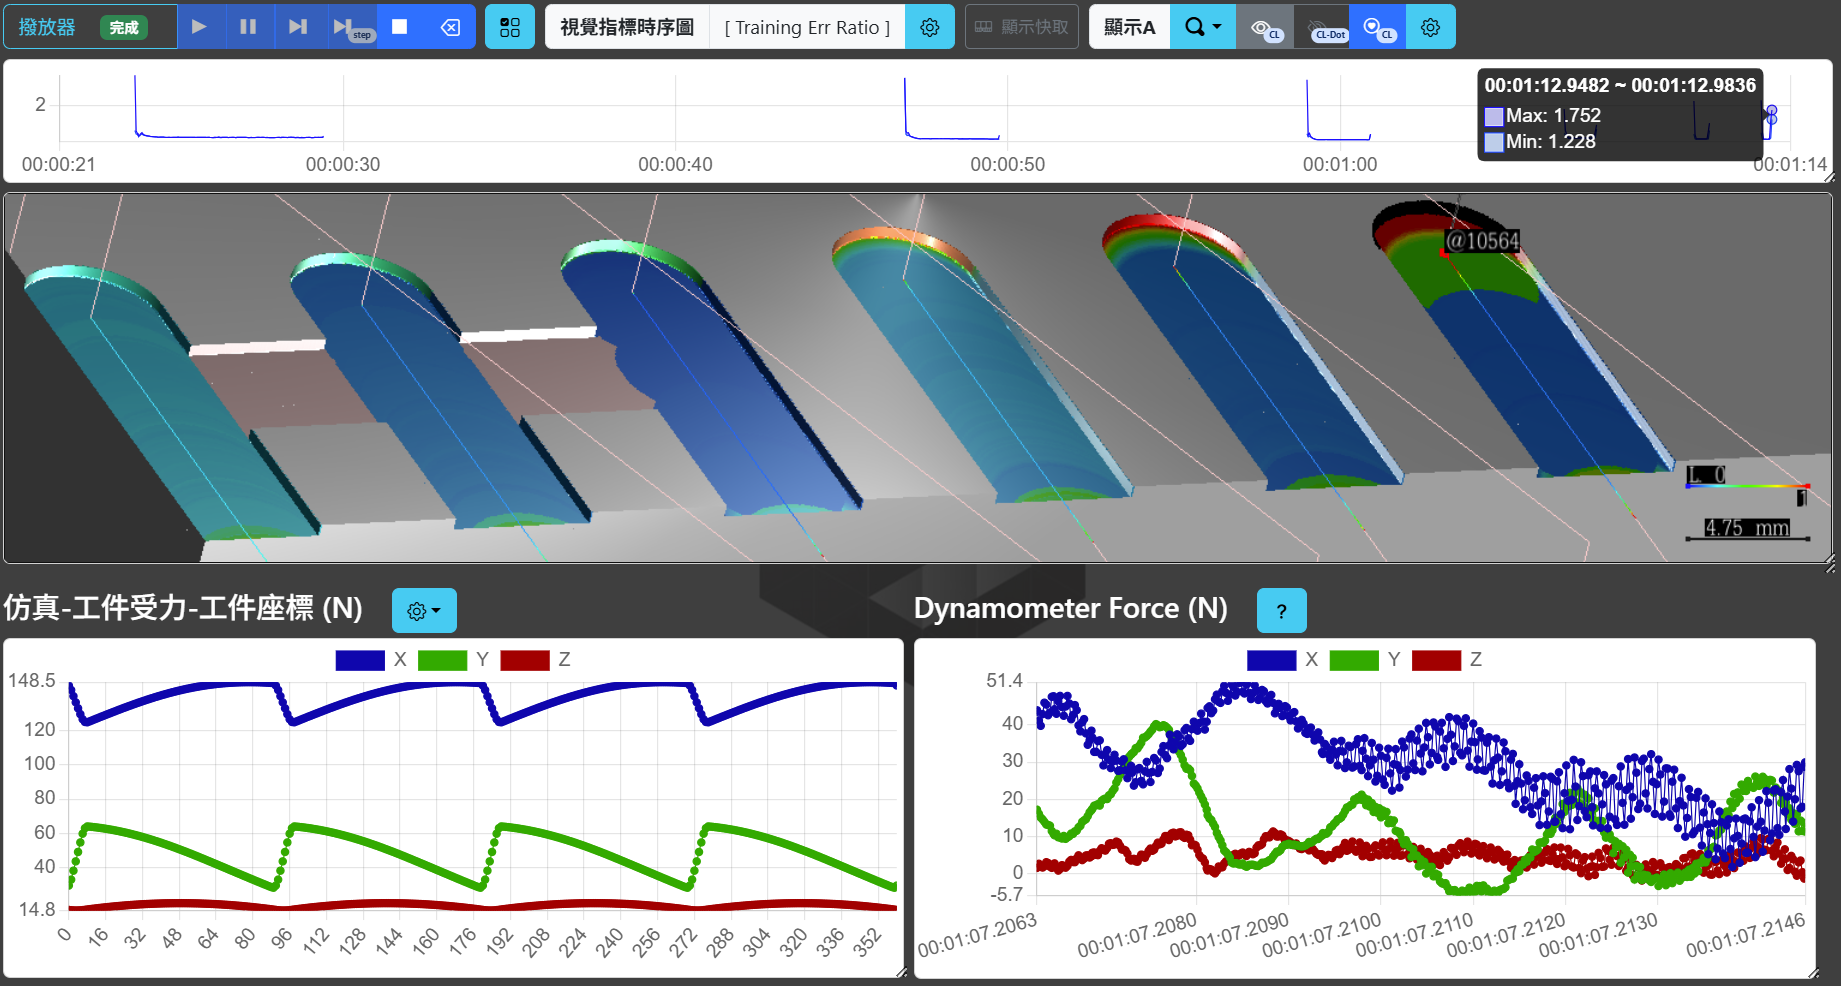
The figure below shows the force simulation error after applying and comparing dynamometer data, with blue-to-red indicating error ratio from low to high:
Error Characteristics
The following characteristics can be observed from the figure:
- Errors increase closer to tool retraction (corners toward the Z direction)
- Higher feed rates result in longer high-error intervals
Error Sources
The errors mainly originate from controller deceleration. From the per-revolution waveform at the F3600 corner in the lower part of the figure:
| Data Source | Description |
|---|---|
| Left (simulated ideal force) | Ideal cutting force calculated based on the set feed rate |
| Right (dynamometer data) | Measured cutting force, approximately one-third of the ideal force |
The test material was S45C. At that location, the actual feed should be even lower than one-third of the ideal feed.
Why Is the Optimized Value Lower Than the Empirical Value?
During NC feed rate optimization, corners often show significant feed rate reductions. Beyond the fact that corners typically produce higher cutting forces, the reason the optimized value is lower than the empirically feasible feed rate is:
The controller has already reduced the feed rate on its own; the optimization simply reveals this.
In other words, the optimization result reflects the feed rate actually executed by the controller, not the feed rate specified in the NC program. This “excessively low” optimized value is in fact the real machine behavior.
Conclusion
When you find that the optimized feed rate at corners is unusually low, this is typically not a system error but rather:
- The controller has already automatically reduced the actual feed rate for safe cornering
- The optimization function faithfully reflects this deceleration behavior
- Even if you set the empirical value, the controller would still decelerate to a similar value during actual machining
Understanding this phenomenon allows you to evaluate optimization results more rationally and adjust cornering strategies or machine parameters as needed.
Tracking the Limiting Physical Quantity per Step
To find out which physical quantity limits the feed rate at each individual step, refer to the Tracking Physical Quantity Constraints of Individual Steps section in Workflow: NC Optimization.