Connecting-Rod Forging Die, Optimized: HiNC's Feed Optimization Takes 24.5 % off the Hand-Revised Programs, and Even the Lowest Feed Leaves the R1.5 Corner over Its Limit
The connecting-rod forging die is the lower die for an aluminium connecting rod that an AI agent designed from a paper's forging drawing and a photograph of the real dies, and programmed itself in three Fanuc programs: a D10 R1 end mill roughs it, a D6 ball and an R1.5 long-neck ball rest-rough and finish it. One half of the die takes 342.8 min. That case found the weak place: in the rib grooves' R1.5 concave corners the R1.5 ball cuts with its whole quarter arc and bends far past the 12.5 µm the agent allowed its finishing. The agent revised the feeds twice by hand; the second revision, which holds descents into the stock and segments where the ball wraps a corner to the plunge feed, takes 439.1 min. Here the agent hands the programs to HiNC's feed optimization and asks what an engineer would ask: can the optimizer hold the corner where the hand revisions could not, at what cost in time, and how much faster can the hand-revised programs run if HiNC may only speed them up?
Three variants were optimized on the whole die at a 0.125 mm grid on HiNC 3.2.45, one program per run, and their programs replayed over a 12 × 11 × 12 mm probe block at the corner at 0.0625 mm. In every variant HiNC takes the roughing program from 64.8 to 41.1 min (−36.6 %) within its spindle-power and tool-stress targets. V1 optimizes the first programs and gives each operation its deflection limit as a target: on the probe block it writes 1,422 of the 1,423 steps over a limit at the 100 mm/min minimum feed, and the R1.5 ball's largest step in steep finishing falls from 112.4 to 23.8 µm. One half of the die then takes 659.0 min, 92 % more than the first programs, because HiNC also slows the 2 mm before and after every step it writes at the minimum to that same feed, and the whole die has thousands of such steps (dilemma 3). V3, the same without those extended windows, takes 251.9 min (−26.5 %) but gives full feed to loads the 0.125 mm grid cannot see: its rest roughing bends up to 89.5 µm. V2 keeps the hand-revised programs and lets HiNC only speed them up: 331.5 min, 24.5 % less than the second revision and 3.3 % less than the first programs, with the second revision's peaks unchanged.
The corner itself is not a feed problem. With every step over its limit at the lowest feed, the R1.5 ball still bends up to 23.8 µm in the groove corner; no feed removes that, and what is left to change is the entry or the size of the ball, as the case page concluded. Everything here is simulated; no die was cut.
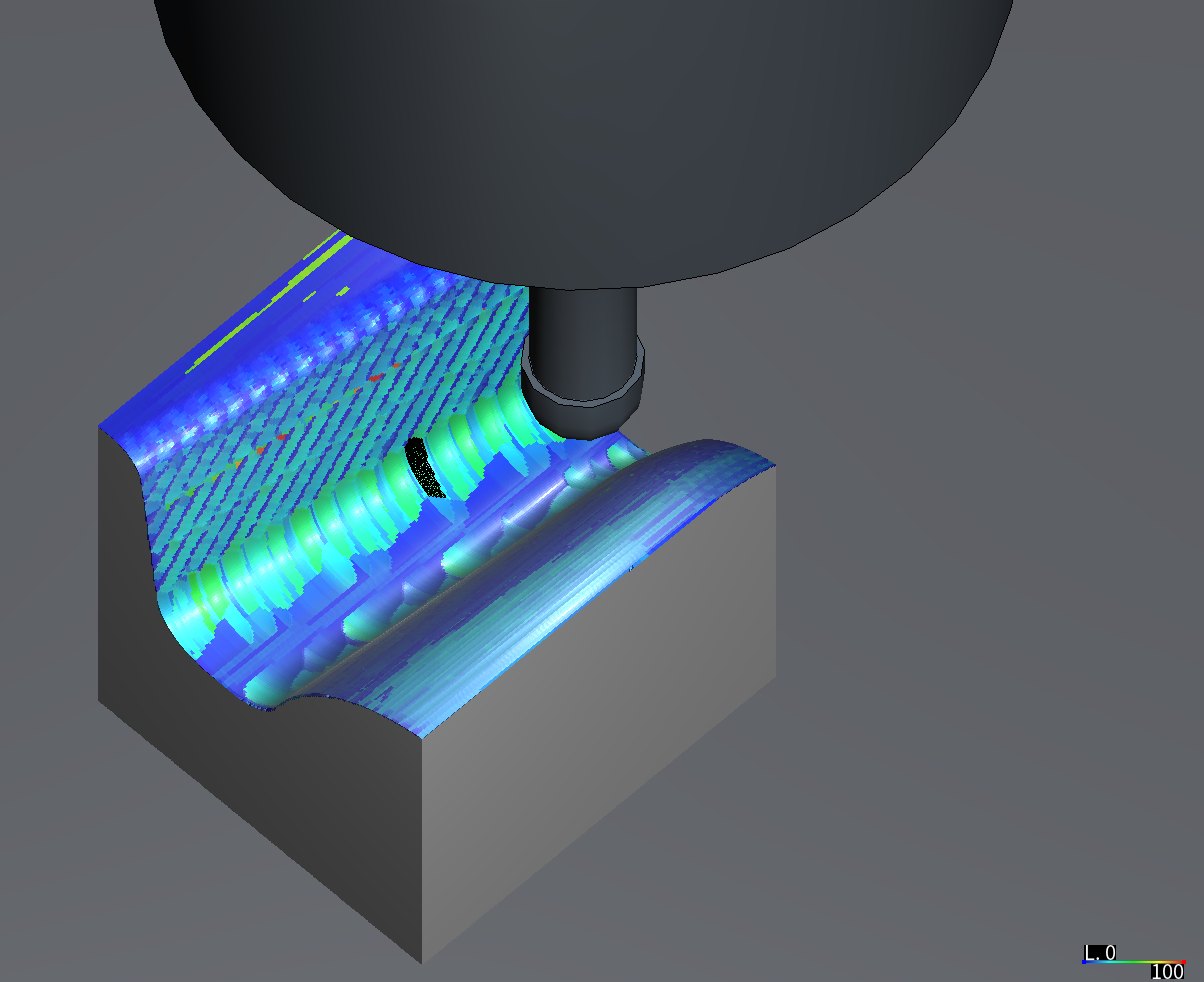
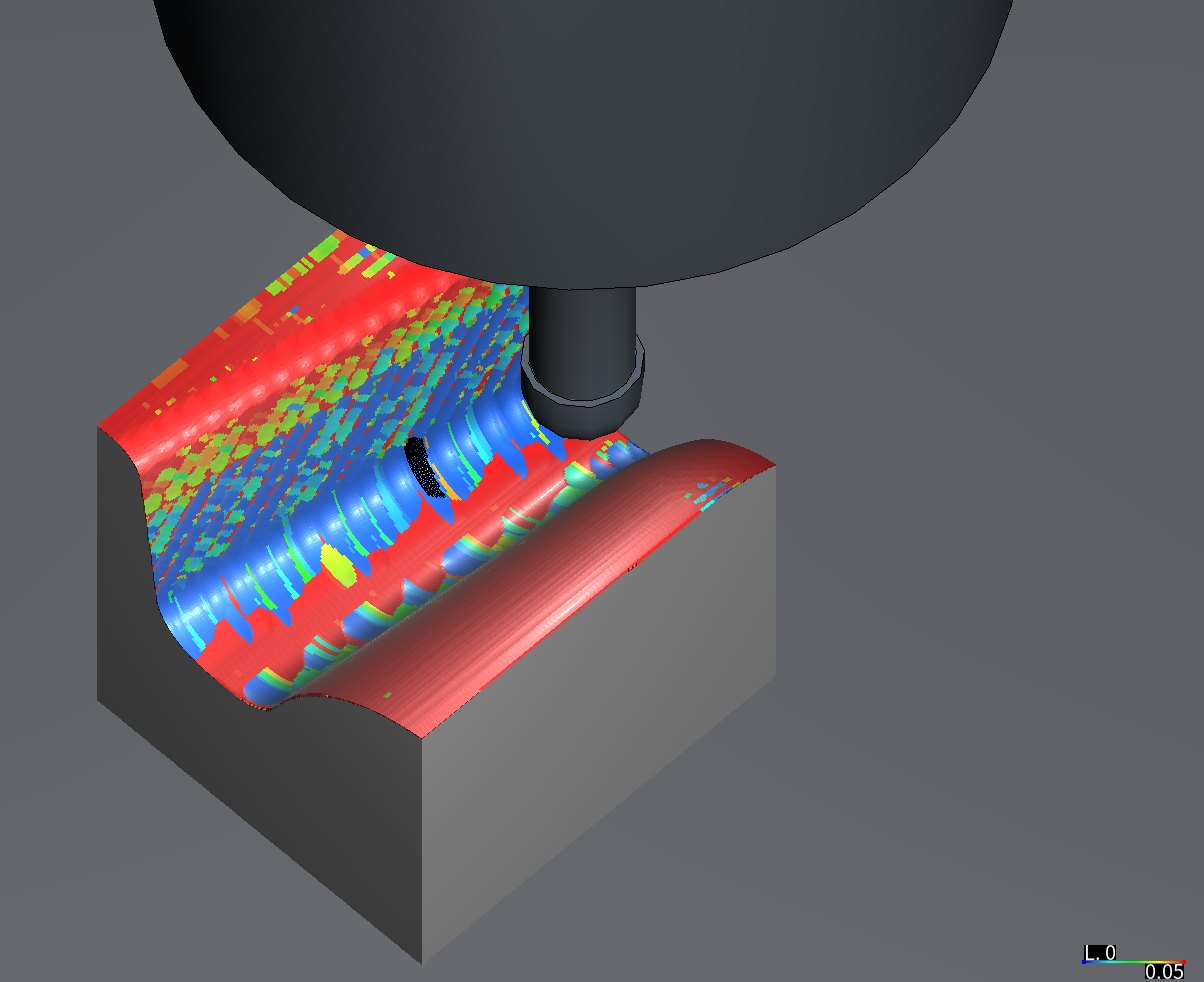
V1's optimized programs played over the probe block and paused with the R1.5 ball in the rib groove: its Ø6 shank below the HSK-A63 shrink-fit chuck, its neck and ball down in the groove. The groove's faces are coloured by the largest force of the steep-finishing step that cut them, 0 to 100 N: green and blue along the corner, where the first programs read red and yellow (dilemma 2). HiNC 3.2.45, 0.0625 mm.
| Measured on HiNC 3.2.45 | First programs | Revision 2, by hand | V1: first programs optimized | V2: revision 2, never slower | V3: V1 without extended windows |
|---|---|---|---|---|---|
| One half of the die, simulated machining time | 342.8 min | 439.1 min (+28.1 %) | 659.0 min (+92.2 %) | 331.5 min (−3.3 %) | 251.9 min (−26.5 %) |
| The same, against revision 2 | −21.9 % | — | +50.1 % | −24.5 % | −42.6 % |
| T1 roughing, whole die | 64.8 min | 64.8 min | 41.1 min (−36.6 %) | 41.1 min | 41.1 min |
| T1 roughing, largest spindle power ratio, whole die | 0.37 | 0.37 | 0.35 | 0.35 | 0.35 |
| T3 steep finishing, XY tip deflection largest / 99th percentile, probe block (limit 12.5 µm) | 112.4 / 32.1 µm | 39.6 / 17.4 µm | 23.8 / 15.0 µm | 39.6 / 17.8 µm | 23.8 / 16.4 µm |
| T3 rest roughing, largest XY tip deflection, probe block (limit 40 µm) | 70.0 µm | 43.9 µm | 39.8 µm | 43.9 µm | 89.5 µm |
| Probe cutting steps over a deflection limit | 3,092 | 1,431 | 1,423 | 1,430 | 1,789 |
| Of them above the minimum feed, where a lower feed was still possible | — | — | 1 | 1,430 | 373 |
| Stock against the source's on the agent's z-map, cells within 1 µm, T2 / T3 | — | — | 99.82 / 99.94 % | 99.98 / 99.93 % | 99.49 / 99.84 % |
| Optimization plays on the whole die, server time | — | — | 72 min | 54 min, with V1's T1 | 40 min, with V1's T1 |
| Peak memory of an optimization play | — | — | 46.3 GiB (T1) | 31.6 GiB | 20.3 GiB |
The case
The die's own case page tells how the agent rebuilt the forging from the paper's drawing, designed the die on the photograph, wrote the programs and played the whole die through an acceptance; this page starts where that one ends. What the agent was given:
- Three accepted programs, the first programs: T1, a D10 R1 end mill at 3,800 rpm, roughs the impression in Z levels and cuts the flat floors to size at F1050 (64.8 min); T2, a D6 ball at 10,000 rpm, rest-roughs and finishes at F1200, Z-level on the steep walls and parallel passes on the shallow ones (101.1 min); T3, the R1.5 long-neck ball at 12,000 rpm, rest-roughs in levels at F900 and finishes at F1200 where the D6 cannot reach (176.9 min). One half of the die, the lower die, takes 342.8 min in 70,567, 190,004 and 400,570 lines.
- Two hand revisions of T2 and T3, which change only feeds: revision 1 slows the feed where the removed section is large (402.9 min for one half); revision 2 also holds steep descents into the stock and segments where a ball wraps a corner to the plunge feed, F500 for T2 and F300 for T3 (439.1 min). Revision 2 is the case's program; revision 1 had not been kept (dilemma 12).
- The pass criterion the case set the small balls: XY tip deflection at most 12.5 µm in T2's and T3's finishing, a quarter of the ±0.05 mm taken as the impression's tolerance, and 40 µm in T3's rest roughing.
- The machine, spindle, tools and holders of that case: HiNC's three-axis skeleton machine, a generic 24,000 rpm spindle rated 7.5 kW continuous and 10 kW short-term, generic solid-carbide tools 20 mm out of HSK-A63 shrink-fit chucks, and FDAC die steel at about 40 HRC.
- The request: showcases of HiNC's NC optimization built on existing cases, asked for by HiNC's product owner.
What nothing states:
- How fast these tools may go. The tools are generic, so no maker's feed-per-tooth limit exists; the ceiling each tool is given is the agent's choice.
- How to hold a deflection limit. HiNC's optimizer holds spindle power, spindle torque, tool stress, a target force and the feed limits; it has no deflection criterion built in, so the 12.5 µm has to be carried by another criterion.
- Whether the grid reads the finishing. T3 leaves 0.04 mm for its finishing and T2 0.12 mm, under the 0.125 mm grid on which the whole die can be optimized.
The case page reports its own acceptance, and where it gives a reading this study also made (the loads on the probe block, the whole die's tip deflections, revision 2's times) it quotes this study. Every number on this page comes from this study's plays on HiNC 3.2.45: the first programs and both revisions were replayed over the same probe block as the optimized variants, so each “before” was measured beside its “after”.
What the agent built
Each value is marked read (from the programs or the case), derived (computed from them), chosen (the agent's choice) or default (HiNC's default, kept).
Each variant is one optimization play per program on the whole die and a replay over the probe block. The optimization play plays the source program with an NC optimization setting before it and writes the optimized file after; its per-step results are the “before”. One program per run: after each program HiNC records the stock, and the next program starts from it, so T2 sees the stock T1 left and T3 the stock T2 left.
| Variant | Source programs | What changes | What it answers |
|---|---|---|---|
| V1 | the first programs | the roughing free up to each tool's ceiling; the finishing held at its programmed feed and capped by its operation's deflection limit; minimum feed 100 mm/min | can the optimizer hold the corner, and at what time |
| V2 | revision 2's T2 and T3, with V1's T1 | V1's settings, and the source-feedrate floor at 100 %: no step slower than revision 2 | how much faster the hand-revised programs run when HiNC may only speed them up |
| V3 | the first programs | V1 with the extended distance before and after each cut set to 0 | what the extended windows cost and what they buy (added after V1, dilemma 3) |
| V4, a trial | the first programs, over the probe block only | V3 with windows of 0.5 mm | whether a short window keeps V3's speed and V1's peaks (dilemma 5) |
Each tool's limits, sent before every optimization play through PUT api/Cutter/{id}/opt-limit
and read back into the run record: optimization on; yield safety factor 3, so the stress is held to a
third of yield; the minimum-chip-thickness and relief-angle limits on; no minimum feed per tooth — all
default — and a feed-per-tooth ceiling of 1.5 times the roughing feed per tooth, chosen. The
ceilings are not a tool maker's data for these tools:
| Tool | Programmed feed per tooth (F ÷ rpm ÷ flutes) — derived | Ceiling — chosen |
|---|---|---|
| T1 D10 R1 end mill, 4 flutes, 3,800 rpm | 0.0691 mm (F1050); 0.0263 mm on the plunges (F400) | 0.1036 mm (F1575) |
| T2 D6 ball, 2 flutes, 10,000 rpm | 0.060 mm (F1200); 0.025 mm on the plunges (F500) | 0.090 mm (F1800) |
| T3 R1.5 ball, 2 flutes, 12,000 rpm | 0.0375 mm rest roughing (F900), 0.050 mm finishing (F1200); 0.0125 mm on the plunges (F300) | 0.05625 mm (F1350) |
The NC optimization setting before every program:
| Setting | Value | Source |
|---|---|---|
| Feed optimization, re-interpolation | on | default |
| Forward, side and depth compensation | off | chosen: compensation is not part of this study |
| Depth splitting | off | chosen |
| Source-feedrate floor | off in V1 and V3; on at 100 % in V2 | default (off); chosen (V2) |
| Lowest and highest feed rate | 100 and 20,000 mm/min | chosen: 100 lies under revision 2's plunge feed F300, so the corner entries can go slower; 20,000 under the machine's 24,000 mm/min rapid |
| Feed for stretches with no cutting | T1 14,560, T2 3,680, T3 2,140 mm/min | derived: the rest-chip rule below |
| Acceleration of feed changes | 1,000 mm/s² | chosen: the default 10 mm/s² would spread every change over hundreds of millimetres |
| Extended distance before and after a cut | 2 mm and 2 mm in V1 and V2; 0 and 0 in V3 | default; chosen (V3) |
| Feed-rate assignment ratio | 0.01 | default |
| Spindle power and torque safety factors | 1.5: the target is 67 % of the short-term rating | default |
| The mission's yield and thermal-yield factors | 0 and 0: the tool's own yield factor 3 holds; thermal yield is not a criterion | default |
| Target force | none for the program; set per operation, below | default |
| Grid | 0.125 mm, the case's acceptance grid | chosen: the optimizer must see the whole program on the whole die to tell cutting from air, and 0.0625 mm on the whole die is too heavy |
The air feed. A grid coarser than the finishing allowance can read a thin cut as air, and the optimizer writes such a stretch at its feed for cutting in air. So each tool's air feed is the feed at which a 12.5 µm layer, what the criterion lets the finishing leave, would cut a chip no thicker than the tool's own finishing chip (T1: its roughing chip). With the chip thickness as feed per tooth × sin φ and cos φ = 1 − 2 × depth ÷ diameter: T1's programmed chip is 67.7 µm (4 mm across), so 14,560 mm/min; T2's 16.8 µm (0.12 mm left), so 3,680; T3's 11.5 µm (0.04 mm left), so 2,140 — derived.
Each operation's own settings, appended as a script comment (@@…) to the operation's first
spindle line so they apply from that line on
(Settings Embedded in NC Code); the
agent's script checked that everything else in each copy is the source's:
| Operation | Target force — derived | Highest feed — chosen | Yield safety factor — derived |
|---|---|---|---|
| T1 Z-level roughing | none | 20,000 mm/min | the tool's 3 |
| T1 floors to size | 376.5 N | 1,050 mm/min, the programmed feed | 5.84 |
| T2 rest roughing | none | 20,000 mm/min | the tool's 3 |
| T2 finishing, steep (Z-level) | 88.4 N | 1,200 mm/min, the programmed feed | 7.03 |
| T2 finishing, shallow (parallel) | 85.7 N | 1,200 mm/min, the programmed feed | 6.85 |
| T3 rest roughing | 69.5 N | 20,000 mm/min | 3.25 |
| T3 finishing, steep (Z-level) | 23.5 N | 1,200 mm/min, the programmed feed | 10.29 |
| T3 finishing, shallow (parallel) | 21.5 N | 1,200 mm/min, the programmed feed | 10.38 |
- Target force = deflection limit ÷ compliance. The compliance is the 95th percentile of the operation's XY tip deflection per newton over its cutting steps on the probe block in the first programs, so that at the target 95 % of the steps stay within the limit: for T3's steep finishing, 12.5 µm ÷ 0.5318 µm/N = 23.5 N.
- Yield safety factor = deflection per unit stress ratio ÷ limit, added after the first trial (dilemma 1). In HiNC's tool-beam model the tip's XY deflection and the stress ratio come from the same bending moment, so each tool's deflection per unit of stress ratio is nearly constant over its cutting steps: 121–130 µm for T3, 79–88 µm for T2, 68–73 µm for T1 (5th to 95th percentile). For T3's steep finishing, 128.6 µm ÷ 12.5 µm = 10.29: the stress held to 1 / 10.29 of yield is 12.5 µm of deflection.
- The finishing is held at its programmed feed: it may slow down but never speed up, because a faster finishing pass bends more, and with HiNC's deflection transformation off, as in these plays, the removed shape does not show the bending.
Not changed by the optimizer: rapid moves, the tool change and length-offset lines, G91 G28 and M
codes. The three programs have no drilling cycle and no arc, only G00 and G01.
The probe block: 12 × 11 × 12 mm at x 22..34, y 1..12, over the rib-groove corner where T3 removes the most, played at 0.0625 mm with clipped programs: only the moves within the tool radius plus 1 mm of the block, each stretch entered and left by rapids from the safe height. All six program versions — the first programs, both revisions, the three variants — are compared there with the same clipping (dilemma 9).
How the agent managed the work
- Criteria and settings first. Nine criteria and every setting with its source were written down and committed before the first optimization play, the trials included. What the trials and each variant changed was written beside the plan before the next play, three times, the original left as written.
- Trimmed first. The clipped first programs went through the whole chain on the probe block — optimize, replay, check that the optimizer really changed the feeds and that each embedded setting reached its operation — before any whole-die play. Two trials; the second checked the remedy of dilemma 1.
- One program per run on the whole die. A private copy of HiNC 3.2.45 on a 32-thread server shared with live instances and other agents' studies. Every heavy play queued on a lock shared with the other studies, started only with 40 GB of the server's memory free and ran on a freshly restarted instance with the project reloaded from its file. A guard stopped the study's own instance if the server's free memory fell under 15 GB; a read-only check every three minutes looked at alarms, the line reached, contact and loads.
- Settings read back. Each tool's limits and the optimization settings were read back after every play and kept with the results, beside the messages, the server time and the memory.
- Decisions fixed before the result. Which variant gets a whole-die replay, and whether a short-window V4 is played on the whole die, were written down before the trials that decided them.
- Where a person stepped in. HiNC's product owner asked for NC-optimization showcases built on existing cases; the variants, the settings and the criteria are the agent's.
The criteria as written before the first optimization play, with the cutting steps defined as the steps in contact that remove more than 0.01 mm³/s:
| # | Criterion |
|---|---|
| O1 | Every line runs, no new alarm: each play runs as many lines as its file has; no Collided and no stroke alarm; no more Play-RapidCut--Detected than the source's play at the same grid; no warning or error the baseline lacks; each optimization play builds its feeds and writes its file |
| O2 | The governing loads stay within their targets: for each tool on the whole die, at least 99 % of the cutting steps at power and torque ratios ≤ 0.667 and a stress ratio within its target; for an operation with a deflection limit, at least 99 % of its cutting steps on the probe within it (after dilemma 1); steps written at the minimum feed counted apart |
| O3 | The shape does not change: (a) on the agent's z-map, each optimized program leaves the same stock as its source, 99.9 % of the cells within 1 µm; (b) the stock HiNC exports from a whole-die replay, against the design, as in the acceptance |
| O4 | Time, predicted: V1 280–345 min for one half and T1 at most 50 min; V2 between V1 and revision 2, 330–420 min; V3, added later, at most revision 2's 439.1 min |
| O5 | Finishing deflection on the probe: in V1 the 99th percentile and the largest step of each T2 and T3 finishing operation no higher than the first programs' (2 % tolerance), with a smaller share of steps over 12.5 µm; in V2 no higher than revision 2's × 1.02 |
| O6 | The air feed never lands on stock: walked on the agent's 0.05 mm z-map in playing order, no move that cuts deeper than 2 µm at a feed above its operation's ceiling × 1.02 |
| O7 | The output files really are rewritten, cleanly: each optimized file differs from its source, with no error from the program manipulation |
| O8 | The corner peaks: on the probe replay, every step over its limit is either written at the minimum feed, with no feed left to lower, or within 2 % of the limit; predicted: what is left are the plunges straight into the corner |
| O9 | What set the feed: each cutting step classified by the limit that set it; predicted T1's roughing at least 80 % at the ceiling, the finishing mostly held, the corner plunges at the minimum |
The dilemmas
Each is told as its situation, the risk had it been missed, how it was noticed, the resolution, and the evidence that the resolution held.
1. A force target that does not lower ramps and plunges
- Situation. The plan held each finishing operation to its deflection limit with a target force, embedded in the program at the operation's first spindle line.
- Risk. Where the target does not act, the finishing runs at its programmed feed with the corner's peaks unchanged, while the settings look as if they hold them.
- How noticed. In the first trial on the probe block, T3's steep finishing still bent up to 41 µm after optimization, and the 99th percentile of its force was still 51.5 N against a 23.5 N target. The agent's check then compared, for every step already above the target, the feed per tooth the force criterion allowed in the optimizer's per-step log with the feed the step had: on all but one of the sloped steps (1,496 of 1,497) and on every plunge (36 of 36, the 208 N plunge into the corner among them) the log gave the upper bound, the feed the step would have had anyway; on level steps the target held (168 of 177). A minimal program shows the same: on a ramp at 36–68 N against a 5 N target the log gives the 0.05 mm upper bound, on the level line after it 0.0089 mm.
- Resolution. Written beside the plan before V1's first whole-die play: the tool-stress criterion carries the deflection limit, through each operation's yield safety factor, because the tip deflection and the stress ratio come from the same bending moment. The target force stays, since it acts on level steps. O2 was rewritten to judge those operations on their deflection.
- Evidence. The second trial: T3's steep finishing on the probe, 99th percentile / largest 32.1 / 112.4 → 15.1 / 23.8 µm; of the 1,366 steps still over 12.5 µm, 1,363 at the 100 mm/min minimum and the other three at 12.6–12.7 µm; T3's rest roughing over 40 µm from 1,112 steps to 2, at 41.2 µm. On the whole die the force criterion still gives the upper bound on 39,051 sloped steps of T3's steep finishing that are above the target, and is solved on 177.
2. Corner steps that no feed can fix
- Situation. O8 asked which of the corner's peaks stay over the limit at the lowest feed the optimizer may write.
- Risk. Read as a feed problem, the corner would be slowed further — a lower minimum, longer windows — at a growing cost in time, without ever meeting the limit.
- How noticed. O8 on V1's probe replay, and the pictures of the same pose before and after.
- Resolution. V1 writes 1,422 of the 1,423 probe steps over a deflection limit at the 100 mm/min minimum: 1,361 in T3's steep finishing, 40 in its shallow finishing, 21 in T2's steep finishing. In the second trial they lay in the rib-groove corner, x 22–34, y 5.7–8.6, z −7.1 to −4.3, at 27–46 N and 13–24 µm. The one step left above the minimum bends 12.71 µm, within 2 % of the limit, so O8 is met as written and its prediction holds: a lower feed cannot take these steps under the limit; what is left to change is the entry into the corner or a ball smaller than the corner, as the case page concluded.
- Evidence. T3's steep finishing on the probe: largest deflection 112.4 → 23.8 µm, largest force 208.3 → 46.0 N, steps over 12.5 µm 23.3 → 6.1 %. The pictures, the chart of the same stretch per half second, and the O8 chart:
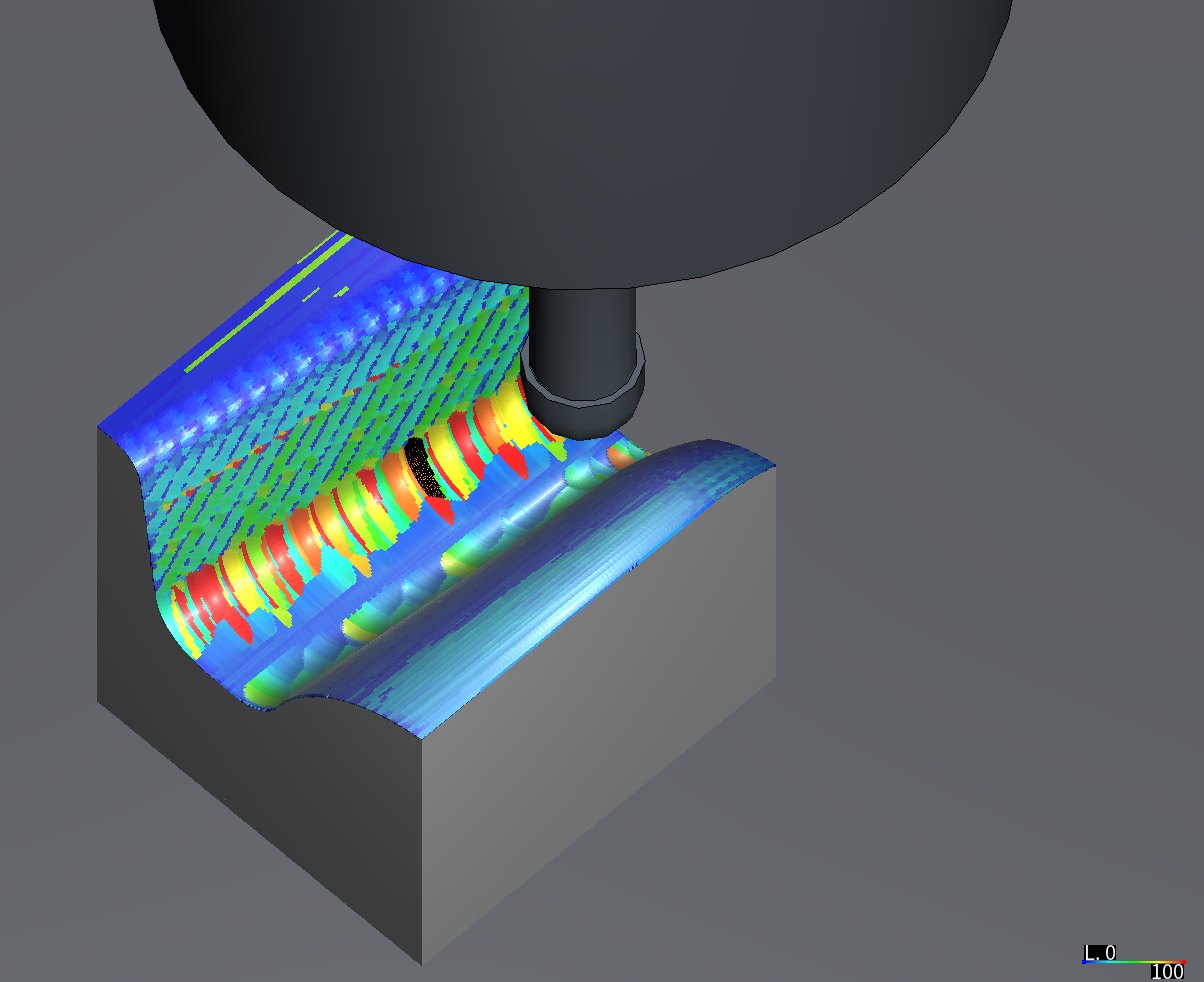
Before: the first programs, the same pose and colouring as the picture at the top, 0 to 100 N. Red and yellow rings run along the groove corner, where the ball's whole arc cuts.
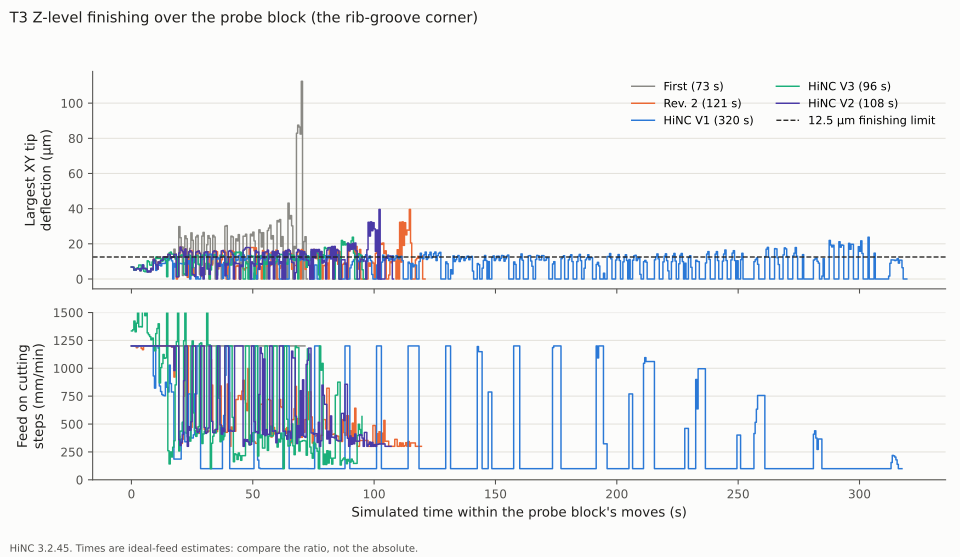
T3's steep finishing over the probe block, per 0.5 s of simulated time. The first programs take 73 s and peak at 112 µm; revision 2 and V2 take 121 and 108 s and peak at 40 µm; V1 and V3 peak at 24 µm, V1 in 320 s because its windows hold the feed at 100 mm/min around every corner step, V3 in 96 s.
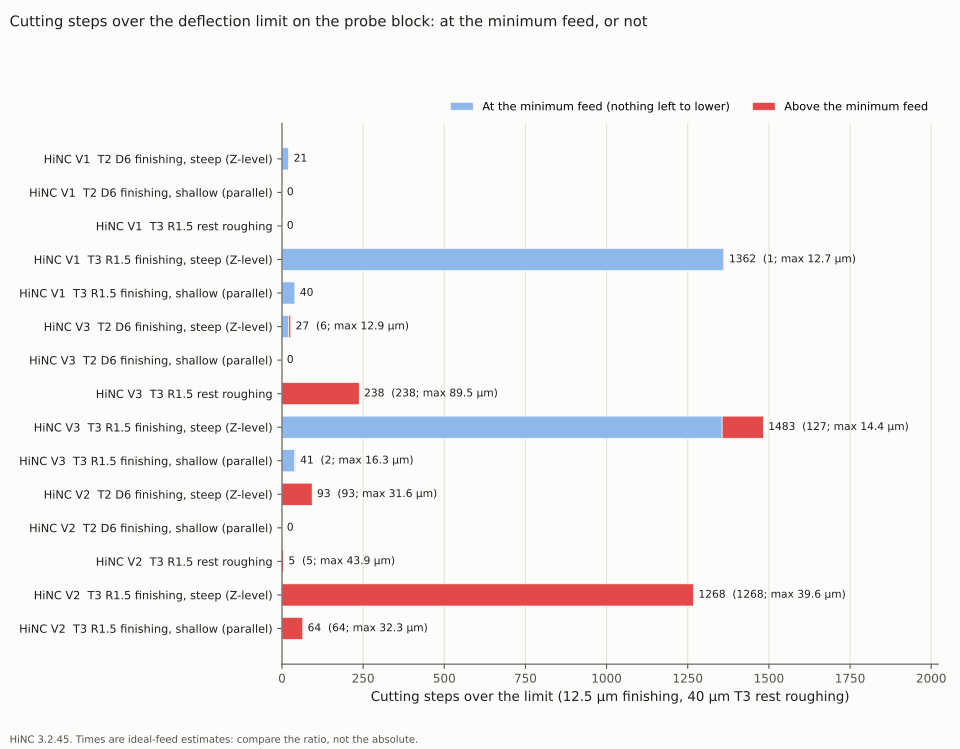
O8. Light blue: steps over the limit already at the 100 mm/min minimum, with no feed left to lower. Red: steps over the limit above the minimum, which a lower feed could still have helped.
3. The extended windows cost more than the slowing itself
- Situation. One half of the die in V1 came to 659.0 min against O4's prediction of 280–345 min, 92 % more than the first programs.
- Risk. Read without the breakdown, the optimizer seems to have slowed the cuts themselves, or the windows' cost is taken for the price of the deflection limit.
- How noticed. The agent's z-map walk of every program, which classifies each move as cutting or in air and weights its feed by time, and the optimizer's per-step log.
- Resolution. The steps in contact, each at the feed solved for it, take only 16 min more than in the first programs: T2 54.9 → 60.6 min, T3 60.9 → 70.9 min. The rest is the extended distance: HiNC slows the 2 mm before and after a step to the lowest feed inside that window, so each of the 4,006 cutting steps of T3's shallow finishing written at the 100 mm/min minimum takes up to 4 mm of path down with it, 2.4 s at that feed. Most of those steps are not in the corner: on the whole die at 0.125 mm the first programs' T3 shallow finishing reads a 99th-percentile force of 156 N (36.5 N on the probe block), because T3's rest roughing levels only along X and leaves more than the nominal 0.04 mm there. The plan was amended: V3, V1 without the windows.
- Evidence. In V1, T3's cutting moves spend 193.6 min at 100–200 mm/min, 127.0 of them in the shallow finishing; in the first programs, none. The charts:
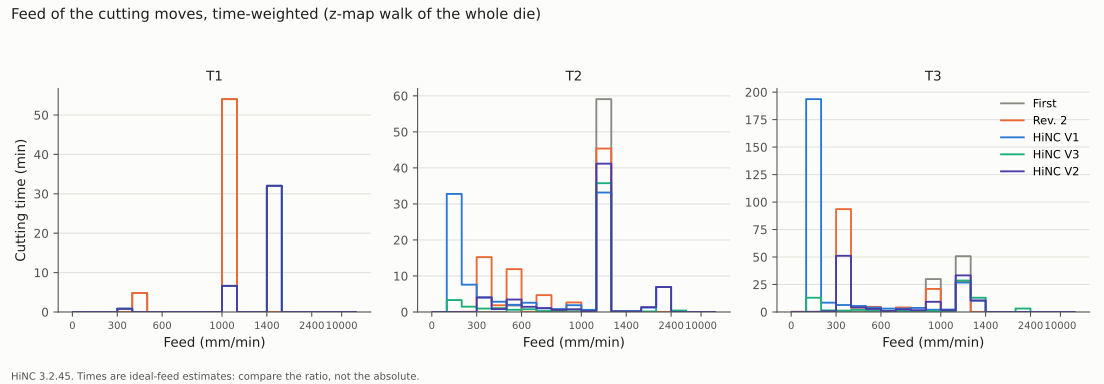
Time of the cutting moves per feed band, from the agent's z-map walk of the whole die. V1's T3 spends 194 min at 100–200 mm/min; V3, solved step by step like V1 but without windows, 13 min.
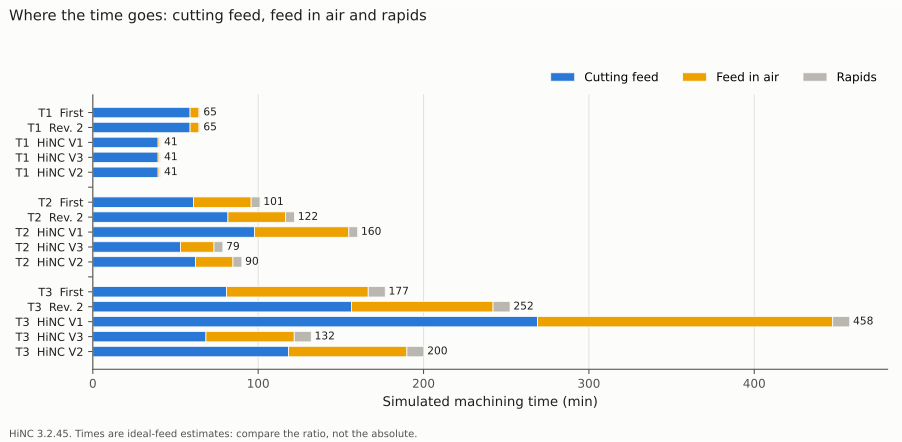
Where the time goes, per tool: cutting feed, feed in air and rapids. The windows drag V1's moves in air down with the cutting ones: T3's feed in air grows from 85.7 to 178.5 min.
4. Without the windows, the grid's blind spots get the full feed
- Situation. V3 drops the windows: 251.9 min for one half, 26.5 % less than the first programs.
- Risk. The 0.125 mm grid is coarser than T3's 0.04 mm finishing allowance. Without windows, a cut the grid reads as light, or as air, gets the ceiling or the air feed, and nothing around it slows it down.
- How noticed. O8 on V3's probe replay and O6 on its z-map walk.
- Resolution. V3 is recorded and judged as written, not recommended. On the probe block T3's rest roughing bends up to 89.5 µm (the first programs 70.0 µm, V1 39.8 µm): that step, at x 23.6, y 6.2, z −5.45, is written at the F1350 ceiling, and the probe reads 157 N and a stress ratio of 0.70 there. 238 rest-roughing steps and 127 steep-finishing steps are over their limit above the minimum feed. On the z-map, 3,156 moves of T2 and 26,838 of T3 cut at a feed above their operation's ceiling, 516 of them deeper than 12.5 µm, the deepest 50 µm, in T2's rest roughing; V1 has 63 such moves, one deeper than 12.5 µm, at 13.8 µm.
- Evidence. The chart of T3's rest roughing over the probe block, and the pictures: each step is solved as in V1 — the corner's steps at the minimum, blue in the feed-per-tooth picture — but the steps beside them keep their own feed.
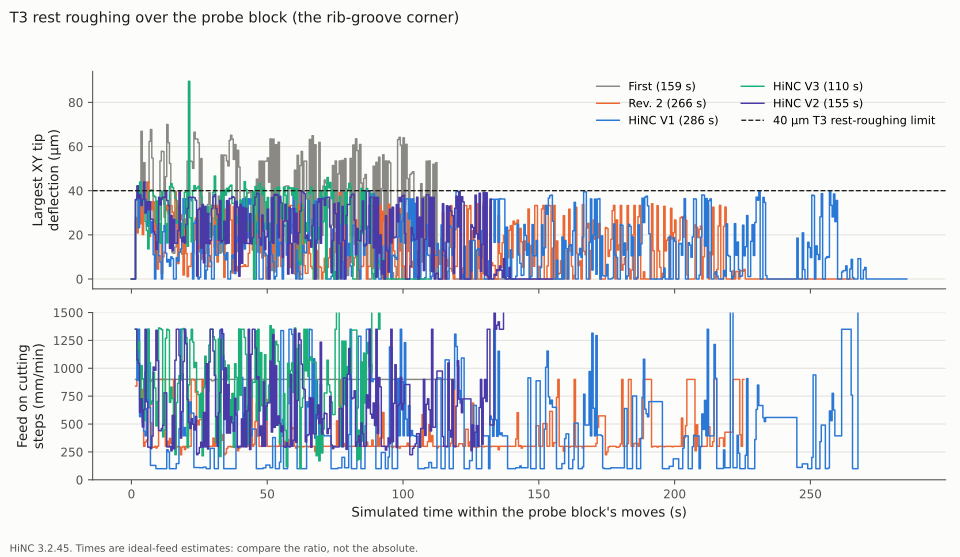
T3's rest roughing over the probe block, per 0.5 s. V3 takes 110 s and spikes to 89.5 µm; V1 holds 40 µm in 286 s.
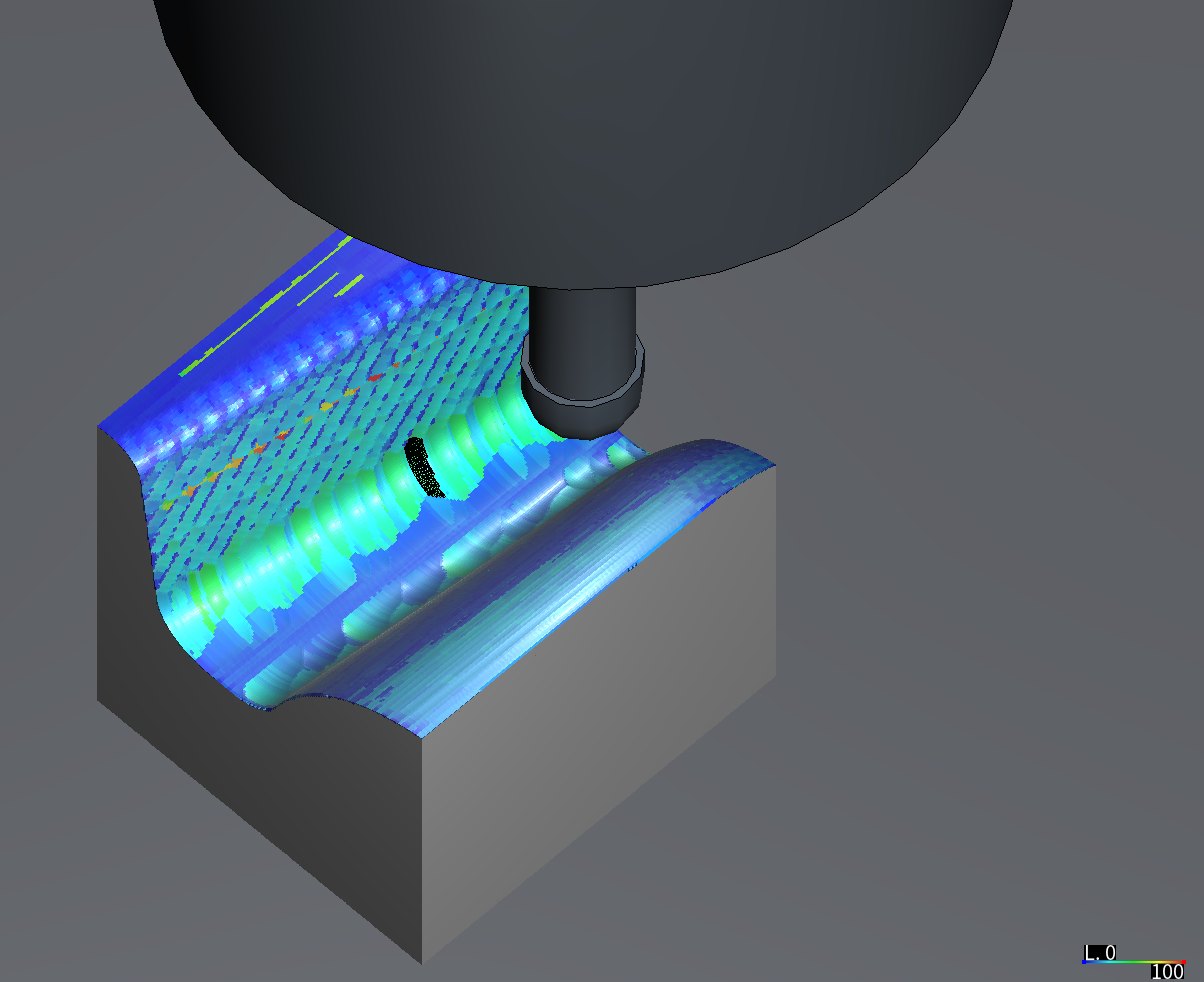
V3, the same pose and force colouring, 0 to 100 N: its steep finishing reads like V1's.
V3 coloured by feed per tooth, 0 to 0.05 mm: blue along the corner, where the steps sit near the minimum feed, and red elsewhere at the finishing's programmed 0.05 mm.
5. What a short window buys
- Situation. A window between 0 and 2 mm might keep most of V3's speed and V1's peaks.
- Risk. A whole-die V4 played on a guess costs about an hour of the shared lock; skipping it leaves the question open.
- How noticed. The rule written before the trial: play on the whole die the shortest window whose probe trial meets O8 and has no air-feed move deeper than 12.5 µm; if none does, play no V4 and report what the windows buy.
- Resolution. A trial on the probe block: the clipped first programs optimized at 0.125 mm and replayed at 0.0625 mm, with no window and with 0.5 mm windows. The trial without windows reproduced the whole die's V3 peak, the same 89.5 µm step, so the trial stands for the whole die. The 0.5 mm window cut the steps over a limit above the minimum from 418 to 22 and the rest roughing's largest from 89.5 to 42.7 µm, and left no air-feed move deeper than 12.5 µm, for 51 % more time on the probe; V1's 2 mm windows cost 142 % over V3 there. O8 still failed at 0.5 mm, so by the rule no V4 was played. A 0.25 mm window would give each step a higher feed than 0.5 mm, never lower peaks, so its trial was dropped while it waited for the lock.
- Evidence.
| Extended window before and after each step | T2 + T3 over the probe | T3 rest roughing: over 40 µm above the minimum / largest | T3 steep finishing: over 12.5 µm above the minimum / largest | T3 shallow / T2 steep finishing: over 12.5 µm above the minimum, largest | Air-feed moves deeper than 12.5 µm |
|---|---|---|---|---|---|
| 0 mm, trial | 5.90 min | 273 / 89.5 µm | 132 / 14.8 µm | 3, 16.3 µm / 10, 12.9 µm | 22 |
| 0.5 mm, trial | 8.92 min | 5 / 42.7 µm | 14 / 13.5 µm | 1, 13.3 µm / 2, 12.6 µm | 0 |
| For comparison: V3 from the whole die, clipped (0 mm) | 7.11 min | 238 / 89.5 µm | 127 / 14.4 µm | 2, 16.3 µm / 6, 12.9 µm | 5 |
| For comparison: V1 from the whole die, clipped (2 mm) | 17.20 min | 0 | 1 / 12.7 µm | 0 / 0 | 0 |
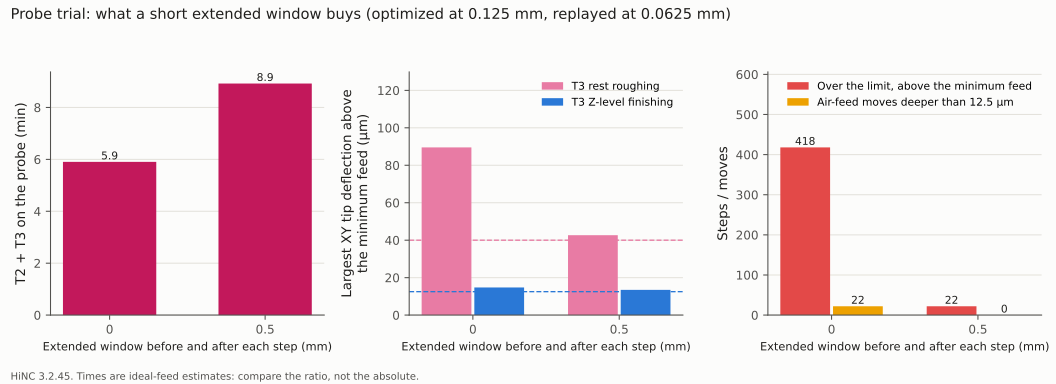
The window trial: what 0.5 mm buys, and what it costs.
6. Never slower than revision 2 keeps revision 2's peaks
- Situation. V2 floors every step at revision 2's own feed. O2 asked for at least 99 % of the cutting steps within the limit, and O5 for the finishing within revision 2's deflection × 1.02.
- Risk. Reading V2 as “HiNC holds the corner”: the floor keeps revision 2's slow steps, and with them revision 2's peaks.
- How noticed. The probe replay against O2 and O5, and the warning
NcOpt-Feed--SourceFloorOverTargetof each optimization play: the floor held 3,062 of T2's steps and 46,230 of T3's above a load target. - Resolution. Judged as written: O2 and O5 are not met. The 1,430 probe steps over a limit — 93 in T2's steep finishing, 1,268 in T3's, 64 in its shallow finishing, 5 in its rest roughing — are revision 2's own, held at revision 2's feed by the floor; none is at the minimum feed. The largest steps equal revision 2's: T3 steep finishing 39.6 µm, rest roughing 43.9 µm. The 99th percentiles are slightly higher than revision 2's, beyond the 2 % tolerance: T2 steep 16.2 against 15.4 µm, T3 steep 17.8 against 17.4 µm, T3 shallow 14.7 against 14.2 µm, and T2 shallow 2.9 against 2.3 µm, far under its limit. What V2 gains, 107.7 min of revision 2's 439.1, comes from three places: 23.7 min in the roughing program, which V2 takes from V1; 44.8 min in the rest roughing of T2 and T3, sped up to its ceiling and sent at the air feed where it cuts nothing; and 39.1 min in their finishing, where segments revision 2 had slowed more than HiNC's limits need run faster again, never above the programmed feed, and moves in air go at the air feed.
- Evidence. The floor set 56 % of T2's steep-finishing steps, 63 % of its shallow-finishing steps, 45 % of T3's steep and 24 % of its shallow: the limits chart.
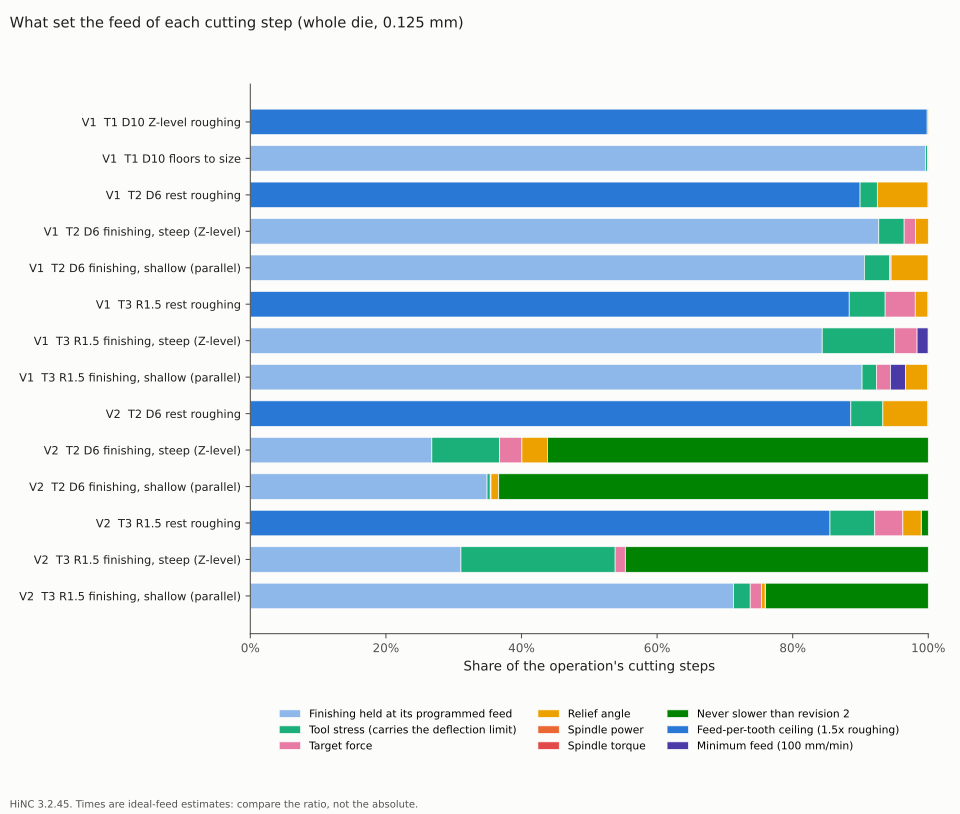
The limit that set each cutting step's feed, from the optimizer's per-step log on the whole die. V3 solves each step as V1 does; only its windows differ, so it is not drawn.
7. A split line keeps the source line's end value on an axis that barely moves
- Situation. Where it re-interpolates the feed, the optimizer splits a source line into fragments,
each written with its own end point and the
(src(...))note of its source line. The agent's check walked every written point back to its source line through those notes. - Risk. A written point off its programmed line moves the tool where the CAM did not put it; on a finishing pass, a step or a gouge in the wall.
- How noticed. O3(a) failed on V3's T2, 99.49 % of the cells within 1 µm, and the check of every point against its line found the reason.
- Resolution. A minimal program shows the behaviour. On
G1 X33 Y6.515from X19 Y6.5, Y rises 0.00008 mm per step. Where a fragment's Y has moved by no more than 0.0001 mm since the line written before it, the optimizer keeps the source line's own Y word — its end value — instead of the fragment's: 7 of the first 10 fragments read Y6.515 where the line is at Y6.5002–6.5011, the tool jumps 15 µm sideways and back at the entry, and the last fragment runs 14 µm off the line. The error is bounded by what is left of that axis's change along the line, so it grows with the line: about 0.14 mm on a 100 mm line at this die's step length. In this die's optimized programs every point more than 1 µm off its line is of this kind, up to 8.6 µm (results). The agent's check moves them back onto the line, and O3(a) is reported both as written and repaired. - Evidence. The chart: the minimal program's line and the fragments written for it, and the points off their line in each optimized program.
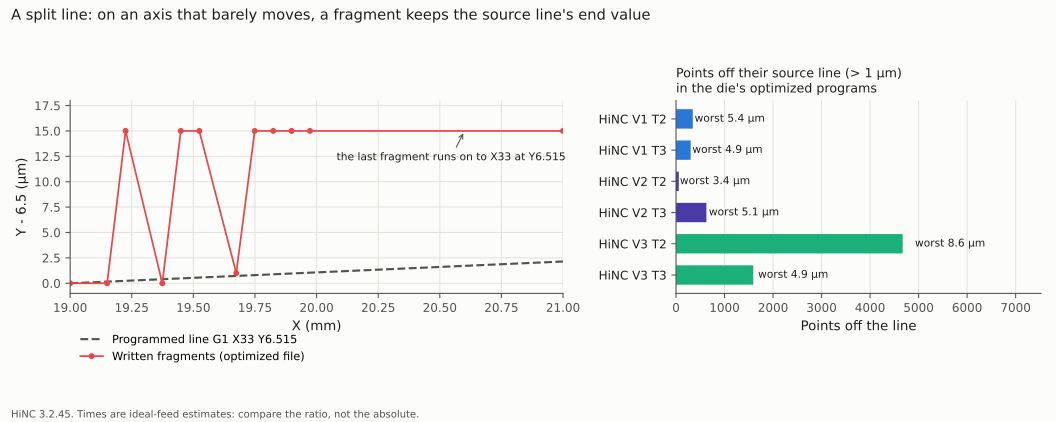
Left: the minimal program, Y drawn in micrometres above 6.5 mm. Right: the points off their source line in the die's optimized programs, with the worst distance.
8. A shape criterion that a steep wall cannot pass
- Situation. O3(a) asked 99.9 % of the z-map cells within 1 µm of the source's stock. With the split points moved back onto their lines, V3's T3 still left 280 cells more than 10 µm apart, the largest 0.149 mm.
- Risk. Calling a real change of shape grid noise, or the reverse.
- How noticed. The O3(a) comparison, cell by cell.
- Resolution. All 280 cells lie on walls steeper than 82.7°, where a cell's height reacts to a sub-micrometre shift of the path. At the cell (35.6, 8.6), source line 175061 is a 0.25 mm straight plunge of the R1.5 ball; at 0.82 of the way down the ball's centre passes 1.499995 mm from the cell, its equator just reaches it and cuts it to z −2.8085. The optimizer split that line at X35.628 Y7.1 — exactly Y7.10033 — so the fragment after the split stays 1.5000 mm or more from the cell and never reaches it, and the cell stays at −2.6842. The surface moved 0.33 µm; the height at that cell moved 0.124 mm. An exact sweep without sampling gives the same differences at the 280 cells, the largest 0.154 mm, so it is the height field on a near-vertical wall, not the z-map's sampling: a 1 µm height criterion cannot judge the shape on such walls. The verdicts stay as written.
- Evidence. The O3(a) table in the results.
9. Clipped programs on a probe block
- Situation. The whole die at 0.0625 mm needs four times the memory per cell of 0.125 mm, too heavy for six program versions, yet the small balls' loads have to be read on a grid nearer their allowance.
- Risk. Probe numbers that differ from what the whole programs do over the block.
- How noticed. In the plan.
- Resolution. The optimization sees the whole programs on the whole die at 0.125 mm; then source and optimized programs are clipped to the moves over the block and replayed there at 0.0625 mm, 1 to 3 min a play.
- Evidence. Played over the block, the clipped first programs touch the stock in the same steps per operation, with the same largest forces, as the whole programs played over the same block: 208.34 N in T3's finishing, 129.71 N in its rest roughing, 176.49 N in T1. The whole T1 program played over the block took 110 s and 2.0 GB.
10. A rapid that met the stock only in the agent's z-map
- Situation. In V1, V2 and V3 a rapid of T3 copied unchanged from the source,
G0 X33.7 Y-6.7at Z−5.23, met the stock 37 to 117 µm deep (at most 0.0014 mm³) in the z-map walk at a 0.05 mm stride; the source program's walk does not. - Risk. An optimized program that cuts with a rapid.
- How noticed. The z-map walk's count of rapids that cut.
- Resolution. Walked again at a 0.01 mm stride from the same stock, neither the source nor V1 meets the stock: the contact is the walk sampling the split moves before the rapid, not the program.
- Evidence. No rapid cuts in the 0.01 mm walks of the source and of V1.
11. A limit nobody set
- Situation. HiNC's relief-angle limit, on by default, keeps the feed per tooth small enough that the edge's clearance face does not press on the uncut material (Relief Face Avoidance). It sets 7.5 % of T2's rest-roughing cutting steps and 5.5 % of its shallow finishing in V1.
- Risk. Reading those slower steps as the load limits the agent set.
- How noticed. The per-step log's classification (O9).
- Resolution. Left on as HiNC's default, and counted apart in the results.
- Evidence. The limits table and chart.
12. The smaller ones
| What happened | Risk | How it showed | Resolution | Evidence it held |
|---|---|---|---|---|
| Revision 1 had not been kept | comparing against a revision that cannot be shown | the plan's inventory | regenerated with the case's own CAM script, which reproduces the kept first programs and revision 2 byte for byte | its times, T2 117.94 and T3 220.10 min, match the 117.9 and 220.1 min recorded for revision 1 |
| T1's optimization play peaked at 46.3 GiB, its replay at 4.9 GiB | crowding the live services on the shared server | the memory record | the guard and the 40 GB rule above; one program per run | every play finished; the guard stopped none |
| The probe trials reached 4.7 GiB and the probe plays 1.9–2.7 GB, over the 1.5 GB a play may use without the lock | two heavy jobs at once on the shared server | the instance's memory | from 20:30 that evening, every probe play queued on the shared lock | the queue flag in every play's record |
| A restarted instance could not take its port while the old one still held it | a chain of plays failing at its start | a failed start | the chain waits for the port to be free before it restarts the instance | every later play started |
| V1's whole-die replay of its three programs would take about 2.5 hours and 30 GB | the lock taken from V3 and V2 | the estimate | by the rule written before, a whole-die replay only for the fastest variant whose peaks are held; none qualified, so only V1's T1 was replayed, and V1's T2 and T3 were judged on the probe and the z-map | T1's replay: every line, 41.11 min, within its targets |
| V2's T3 was queued to start from the stock the first programs' T2 left, not revision 2's | V2's T3 optimized on the wrong stock | noticed while it waited for the lock | stopped before it started; revision 2's T2 played on its own to record its stock, then V2's T3 optimized on it | V2's O3(a) compares with revision 2's own stock |
| The shared lock does not serve in order; one wait lasted over an hour | the study's tail never getting its turn | the queue times | the 0.25 mm window trial dropped (dilemma 5) and three planned pictures with it, one of which waited 83 min; T1's replay kept | the T1 replay waited 64 min and ran |
| The picture plays and the trials share one small instance | a queued trial replacing the play to be photographed | the queue order | queued trials stopped until each picture was taken, then queued again | the four pictures on this page |
Results and benefits
Measured on HiNC 3.2.45: the optimization plays on the whole die at 0.125 mm, one program per run; the replays of the clipped programs over the probe block at 0.0625 mm; T1's replay on the whole die at 0.125 mm. The times of the optimized T2 and T3 programs are the agent's z-map arithmetic, feed length over feed and rapids at 24 m/min, because their whole-die replays were not played; where HiNC played a program on the whole die — the three first programs, revision 2's T2 and T3, V1's T1 — its own simulated time is within 0.04 % of that arithmetic.
| # | V1, first programs, 2 mm windows | V2, revision 2, never slower | V3, first programs, no windows |
|---|---|---|---|
| O1 | met. The three optimization plays ran every line (70,567 / 190,004 / 400,570), built their feeds and wrote their files; the only warning, one Play-RapidCut--Detected in T1, is the source program's own rapid, 0.0002461 mm³. The probe replay ran every line with no warning. T1's whole-die replay: every line, no Collided, the same rapid message, 41.114 min |
met. One NcOpt-Feed--SourceFloorOverTarget per optimization play, the floor's expected report; every line run (190,014 / 400,577); probe replay with no warning |
met. As V1; probe replay with no warning |
| O2 | met on the probe: one step over a limit above the minimum feed, 12.71 µm in T3's steep finishing. T1 on the whole die: of 186,846 cutting steps, none over 0.667 in power or torque or over its stress target | not met as written: 93 steps in T2's steep finishing, 1,268 in T3's, 64 in its shallow finishing and 5 in its rest roughing over a limit above the minimum feed — revision 2's own steps, held at its feed by the floor | not met: 238 steps in T3's rest roughing (2.2 %, up to 89.5 µm) and 127 in its steep finishing (1.0 %) |
| O3(a) | T1 100 % (largest 0.13 µm), met; T2 99.82 %, not met (99.99 % with the split points repaired); T3 99.94 %, met | T2 99.98 %, T3 99.93 %, against revision 2's own stock: met | T2 99.49 %, not met (99.996 % repaired); T3 99.84 %, not met (99.896 % repaired, the rest on steep walls, dilemma 8) |
| O3(b) | not done: no whole-die replay of T2 and T3 | not done | not done |
| O4 | predicted 280–345 min, measured 659.0: missed (dilemma 3); T1 predicted at most 50 min, measured 41.1: met | predicted 330–420 min, measured 331.5: met | predicted at most 439.1 min, measured 251.9: met |
| O5 | met: every T2 and T3 finishing operation's 99th percentile and largest step below the first programs', with no larger share over 12.5 µm (T3 steep 23.3 → 6.1 %) | not met as written: largest steps equal to revision 2's; 99th percentiles above revision 2's × 1.02 in all four finishing operations (dilemma 6) | met in the finishing; its rest roughing fails O2 and O8 |
| O6 | not met as written: 1, 20 and 42 moves of T1, T2 and T3 cut at a feed above their ceiling, only one deeper than 12.5 µm, at 13.8 µm; the rest 2–11 µm grazes | not met as written: 1, 20 and 43 moves, one deeper than 12.5 µm, at 13.8 µm | not met: 3,156 moves of T2 and 26,838 of T3, 516 deeper than 12.5 µm, the deepest 50 µm |
| O7 | met: every file differs from its source; no error from the program manipulation | met | met |
| O8 | met: 1,422 of 1,423 steps over a limit at the minimum feed, the last within 2 % | not applicable: its steps over a limit are held at revision 2's feed | not met: 238 rest-roughing, 127 steep-finishing, 6 T2 steep and 2 T3 shallow-finishing steps above the minimum |
| O9 | as predicted: T1's roughing 99.8 % at the ceiling; T2 and T3 finishing 84–93 % held at the programmed feed; the corner plunges at the minimum | the floor sets 24–63 % of the finishing steps | each step solved as in V1; only the windows differ |
The time, tool by tool, for one half of the die (min):
| Program version | T1 | T2 | T3 | One half | Against the first programs | Against revision 2 |
|---|---|---|---|---|---|---|
| First programs | 64.84 | 101.12 | 176.85 | 342.8 | — | −21.9 % |
| Revision 1, by hand | 64.84 | 117.94 | 220.10 | 402.9 | +17.5 % | −8.3 % |
| Revision 2, by hand | 64.84 | 121.98 | 252.33 | 439.1 | +28.1 % | — |
| V1, 2 mm windows | 41.10 | 160.19 | 457.75 | 659.0 | +92.2 % | +50.1 % |
| V2, revision 2, never slower | 41.10 | 90.12 | 200.23 | 331.5 | −3.3 % | −24.5 % |
| V3, no windows | 41.10 | 78.65 | 132.11 | 251.9 | −26.5 % | −42.6 % |
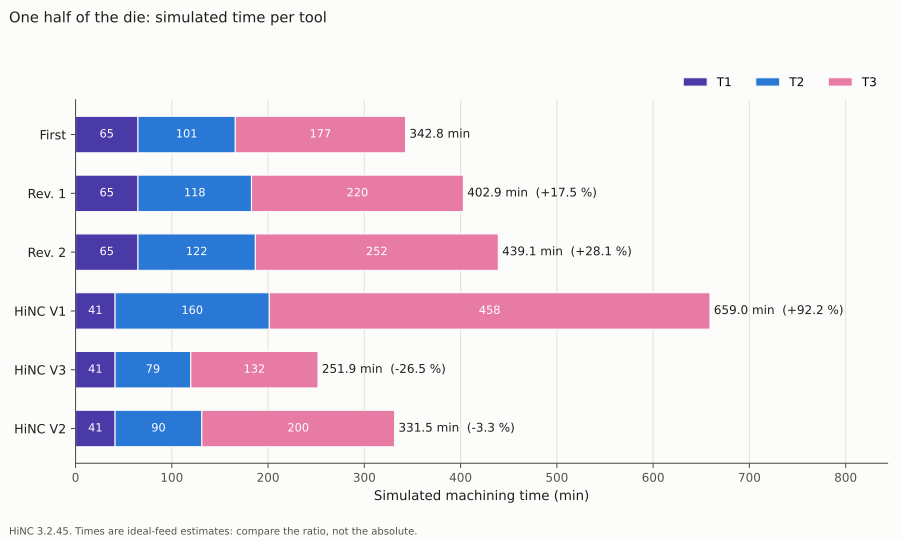
One half of the die by tool. T1 drops from 65 to 41 min in every variant; the variants differ in T2 and T3.
Where the time goes, per tool and version, from the z-map walk (min):
| Tool | Version | Cutting feed | Feed in air | Rapids |
|---|---|---|---|---|
| T1 | first programs, revisions 1 and 2 | 58.83 | 5.41 | 0.61 |
| T1 | every variant | 39.50 | 0.99 | 0.61 |
| T2 | first programs | 60.87 | 34.88 | 5.37 |
| T2 | revision 2 | 81.73 | 34.88 | 5.37 |
| T2 | V1 | 97.80 | 57.02 | 5.37 |
| T2 | V2 | 62.17 | 22.59 | 5.37 |
| T2 | V3 | 52.98 | 20.31 | 5.37 |
| T3 | first programs | 80.91 | 85.65 | 10.29 |
| T3 | revision 2 | 156.39 | 85.66 | 10.29 |
| T3 | V1 | 268.94 | 178.52 | 10.29 |
| T3 | V2 | 118.36 | 71.58 | 10.29 |
| T3 | V3 | 68.42 | 53.39 | 10.29 |
In the first programs 37 % of the time is feed in air: T3's levelled rest roughing and its parallel finishing cross ground that has no stock left. Neither hand revision changed that; the optimizer sends a stretch with no cutting within its windows at the tool's air feed.
The small balls on the probe block. XY tip deflection per spindle revolution over the cutting steps, 99th percentile / largest, with the share of steps over the limit:
| Operation (limit) | First programs | Revision 1 | Revision 2 | V1 | V2 | V3 |
|---|---|---|---|---|---|---|
| T2 D6 finishing, steep (12.5 µm) | 46.3 / 68.1 µm (14.6 %) | 16.2 / 68.1 µm (1.5 %) | 15.4 / 31.6 µm (1.9 %) | 10.7 / 14.2 µm (0.2 %) | 16.2 / 31.6 µm (2.3 %) | 12.0 / 14.2 µm (0.6 %) |
| T2 D6 finishing, shallow (12.5 µm) | 3.0 / 3.4 µm (0) | 2.3 / 3.4 µm (0) | 2.3 / 3.4 µm (0) | 2.9 / 3.4 µm (0) | 2.9 / 3.4 µm (0) | 2.9 / 3.4 µm (0) |
| T3 R1.5 rest roughing (40 µm) | 53.4 / 70.0 µm (11.3 %) | 47.2 / 65.1 µm (5.7 %) | 33.2 / 43.9 µm (0.02 %) | 36.5 / 39.8 µm (0) | 38.0 / 43.9 µm (0.03 %) | 41.0 / 89.5 µm (2.2 %) |
| T3 R1.5 finishing, steep (12.5 µm) | 32.1 / 112.4 µm (23.3 %) | 18.0 / 112.4 µm (10.2 %) | 17.4 / 39.6 µm (10.0 %) | 15.0 / 23.8 µm (6.1 %) | 17.8 / 39.6 µm (11.4 %) | 16.4 / 23.8 µm (11.7 %) |
| T3 R1.5 finishing, shallow (12.5 µm) | 20.5 / 96.7 µm (1.8 %) | 14.7 / 96.7 µm (1.4 %) | 14.2 / 32.3 µm (1.4 %) | 12.3 / 18.3 µm (0.7 %) | 14.7 / 32.3 µm (1.6 %) | 13.4 / 18.1 µm (1.3 %) |
The largest force and stress ratio on the same steps:
| Operation | First programs | Revision 1 | Revision 2 | V1 | V2 | V3 |
|---|---|---|---|---|---|---|
| T2 finishing, steep: force / stress ratio | 516 N / 0.84 | 516 N / 0.84 | 231 N / 0.38 | 111 N / 0.16 | 231 N / 0.38 | 111 N / 0.16 |
| T3 rest roughing | 130 N / 0.56 | 120 N / 0.52 | 83 N / 0.35 | 74 N / 0.31 | 83 N / 0.35 | 157 N / 0.70 |
| T3 finishing, steep | 208 N / 0.91 | 208 N / 0.91 | 74 N / 0.32 | 46 N / 0.19 | 74 N / 0.32 | 46 N / 0.19 |
| T3 finishing, shallow | 173 N / 0.76 | 173 N / 0.76 | 58 N / 0.25 | 34 N / 0.14 | 58 N / 0.25 | 34 N / 0.14 |
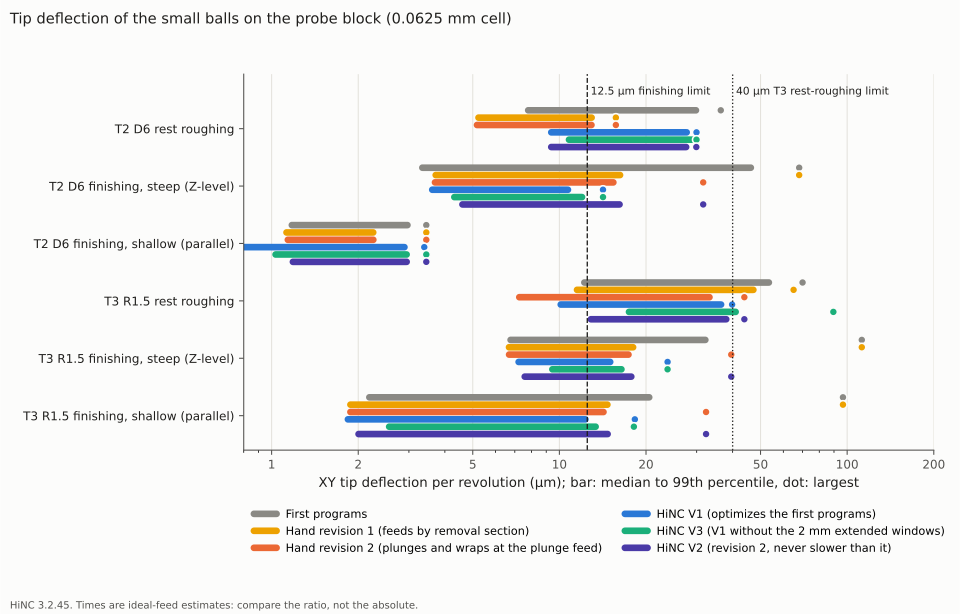
Tip deflection per spindle revolution on the probe block, on a logarithmic scale. Each bar runs from the median to the 99th percentile; the dot is the largest step. Dashed: the 12.5 µm finishing limit; dotted: the 40 µm limit of T3's rest roughing.
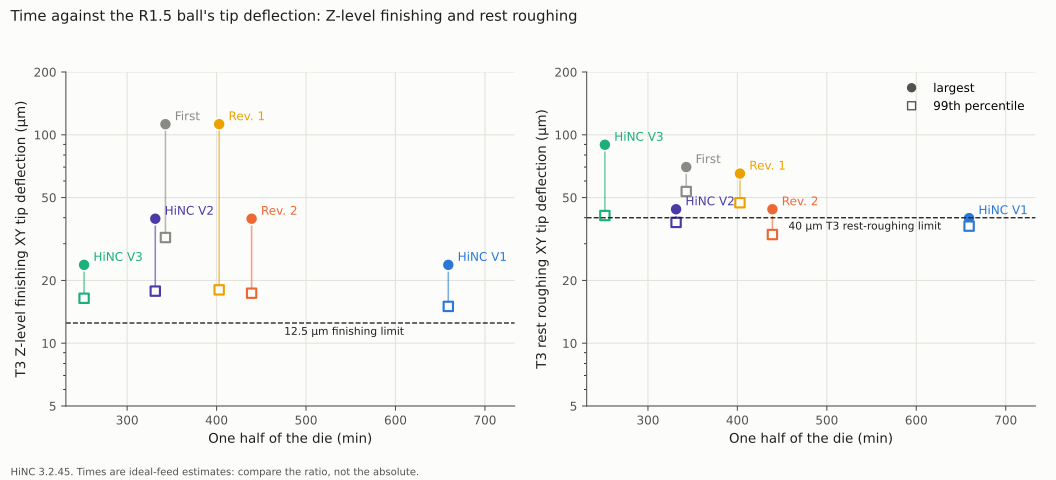
Time against the R1.5 ball's deflection, Z-level finishing on the left and rest roughing on the right. No version sits low and to the left in both panels: V1 has the lowest peaks and is the slowest, V3 is fastest and fails the rest roughing, V2 is faster than the first programs at revision 2's peaks.
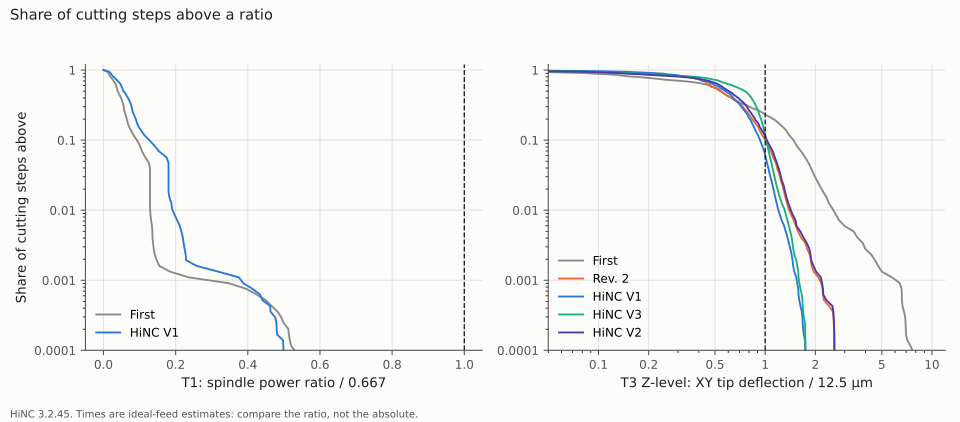
Left: T1's power stays far from its target in both, at most 0.55 of it. Right: T3's steep finishing against 12.5 µm. The curves are cut at one step in 10,000, just short of the largest steps: 9 times the limit in the first programs, 3.2 times in revision 2 and V2, 1.9 times in V1 and V3.
The roughing tool on the whole die, the first program's optimization play against V1's replay:
| T1 D10 R1, whole die at 0.125 mm | First program | V1 |
|---|---|---|
| Simulated time | 64.86 min | 41.11 min |
| Cutting steps | 242,121 | 186,846 |
| Feed per tooth, median | 0.069 mm | 0.104 mm |
| Spindle power ratio, short-term rating, largest / 99th percentile | 0.37 / 0.086 | 0.35 / 0.126 |
| Spindle power ratio, continuous rating, largest | 0.49 | 0.46 |
| Torque ratio, largest | 0.15 | 0.14 |
| Stress ratio, largest | 0.30 | 0.27 |
| Force, largest / 99th percentile | 813 / 337 N | 775 / 392 N |
| XY tip deflection, largest / 99th percentile | 18.1 / 5.7 µm | 17.6 / 7.8 µm |
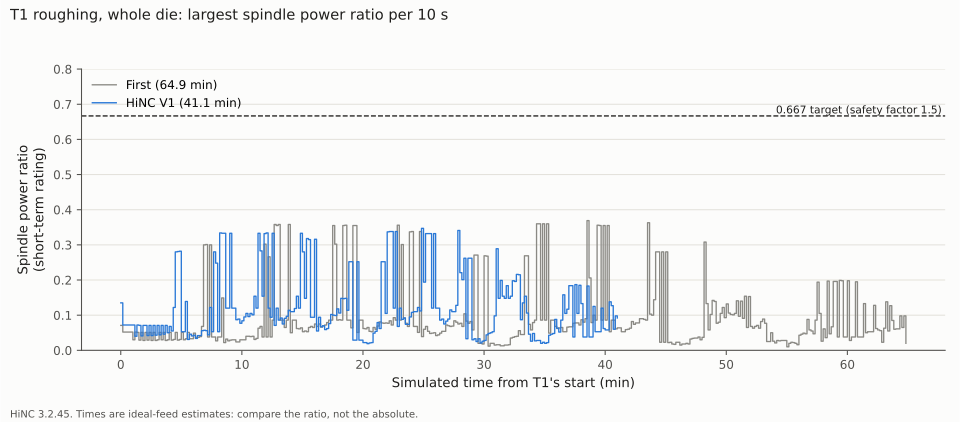
T1 on the whole die, the largest spindle power ratio per 10 s. The spindle is not what sets T1's feed; the ceiling is.
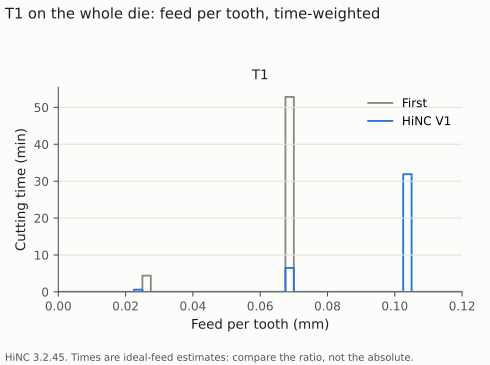
T1's cutting time by feed per tooth: V1 moves it from the programmed 0.069 mm to the 0.104 mm ceiling.
What set the feed, from the optimizer's per-step log on the whole die: for each step, the limit that allowed the lowest feed in the step's own solve, before the extended windows and the acceleration smoothing lower some feeds further (dilemma 3):
| Variant, operation | Cutting steps | Ceiling | Held at the programmed feed | Never slower than revision 2 | Tool stress | Target force | Relief angle | Minimum feed |
|---|---|---|---|---|---|---|---|---|
| V1, T1 Z-level roughing | 209,381 | 99.8 % | — | — | — | — | 0.2 % | — |
| V1, T1 floors to size | 32,739 | — | 99.6 % | — | 0.3 % | 0.1 % | 0.1 % | — |
| V1, T2 rest roughing | 127,960 | 89.9 % | — | — | 2.5 % | — | 7.5 % | 2 steps |
| V1, T2 finishing, steep | 212,832 | — | 92.7 % | — | 3.7 % | 1.7 % | 1.9 % | 0.02 % |
| V1, T2 finishing, shallow | 234,669 | — | 90.6 % | — | 3.8 % | 0.2 % | 5.5 % | 8 steps |
| V1, T3 rest roughing | 277,908 | 88.3 % | — | — | 5.3 % | 4.4 % | 1.9 % | — |
| V1, T3 finishing, steep | 349,776 | — | 84.4 % | — | 10.7 % | 3.3 % | 0.02 % | 1.6 % |
| V1, T3 finishing, shallow | 178,373 | — | 90.2 % | — | 2.1 % | 2.1 % | 3.2 % | 2.2 % |
| V2, T2 rest roughing | 155,475 | 88.6 % | — | 7 steps | 4.7 % | — | 6.6 % | — |
| V2, T2 finishing, steep | 286,249 | — | 26.8 % | 56.2 % | 10.0 % | 3.3 % | 3.8 % | — |
| V2, T2 finishing, shallow | 303,428 | — | 34.9 % | 63.4 % | 0.5 % | 0.1 % | 1.1 % | — |
| V2, T3 rest roughing | 466,601 | 85.5 % | — | 1.0 % | 6.6 % | 4.1 % | 2.7 % | — |
| V2, T3 finishing, steep | 547,027 | — | 31.1 % | 44.7 % | 22.7 % | 1.5 % | 0.02 % | — |
| V2, T3 finishing, shallow | 419,113 | — | 71.3 % | 24.0 % | 2.5 % | 1.7 % | 0.5 % | — |
Spindle power and torque set at most 0.1 % of any operation's steps. The cutting steps here are those of the source program in the optimization play.
The shape on the agent's z-map, each optimized program walked from the stock its source started from and compared with the source's own walk, cells within 1 µm (criterion 99.9 %), as written and with the split points moved back onto their lines:
| Program | V1 as written / repaired | V2 as written / repaired | V3 as written / repaired | Largest difference, as written |
|---|---|---|---|---|
| T1 | 100 % | V1's T1 | V1's T1 | 0.13 µm |
| T2 | 99.82 / 99.99 % | 99.98 / 99.996 % | 99.49 / 99.996 % | V1 7.2, V2 6.1, V3 8.6 µm |
| T3 | 99.94 / 99.96 % | 99.93 / 99.97 % | 99.84 / 99.896 % | V1 20.4, V2 36.7, V3 148.9 µm |
Points off their programmed line, every point of each optimized file walked back to its source line:
| Program | Points written | More than 1 µm off their line | Worst |
|---|---|---|---|
| V1 T1 | 70,857 | 0 | 0.6 µm |
| V1 T2 | 203,523 | 346 | 5.4 µm |
| V1 T3 | 441,258 | 302 | 4.9 µm |
| V2 T2 | 195,978 | 57 | 3.45 µm |
| V2 T3 | 437,181 | 626 | 5.1 µm |
| V3 T2 | 261,298 | 4,672 | 8.6 µm |
| V3 T3 | 564,225 | 1,592 | 4.9 µm |
The air feed against the stock (O6), moves that cut deeper than 2 µm at a feed above their operation's ceiling, on the agent's 0.05 mm z-map:
| Variant | T1 | T2 | T3 | Deeper than 12.5 µm | Deepest |
|---|---|---|---|---|---|
| V1 | 1 | 20 | 42 | 1 | 13.8 µm, T3 rest roughing |
| V2 | 1 | 20 | 43 | 1 | 13.8 µm, T3 rest roughing |
| V3 | 1 | 3,156 | 26,838 | 516 | 50 µm, T2 rest roughing |
The optimized files (the optimizer splits lines where it re-interpolates the feed):
| Program | Lines, source → optimized | Feed words, source → optimized | Feeds written | Lines at the air feed |
|---|---|---|---|---|
| V1 T1 | 70,568 → 70,878 | 306 → 591 | 367–14,560 mm/min | 203 |
| V1 T2 | 190,005 → 203,547 | 646 → 24,706 | 100–3,680 mm/min | 4,395 |
| V1 T3 | 400,571 → 441,281 | 30,257 → 62,426 | 100–2,140 mm/min | 9,617 |
| V2 T2 | 190,015 → 196,012 | 24,003 → 20,815 | 300–3,680 mm/min | 4,403 |
| V2 T3 | 400,578 → 437,211 | 89,718 → 106,996 | 100–2,140 mm/min | 9,818 |
| V3 T2 | 190,005 → 261,322 | 646 → 130,845 | 100–3,680 mm/min | 40,096 |
| V3 T3 | 400,571 → 564,248 | 30,257 → 340,826 | 100–2,140 mm/min | 121,307 |
What the runs cost, on the shared 32-thread server:
| Play | Steps | Server time | Peak memory |
|---|---|---|---|
| T1 optimization play, whole die (used by every variant) | 275,011 | 29.1 min | 46.3 GiB |
| V1: T2 and T3 optimization plays | 1,105,079 and 2,342,051 | 14.3 and 28.5 min | about 20 and 20.5 GiB |
| V3: T2 and T3 optimization plays | 1,105,079 and 2,342,051 | 12.3 and 28.0 min | 20.3 and 20.2 GiB |
| V2: T2 and T3 optimization plays | 1,315,363 and 3,249,370 | 16.4 and 37.9 min | 31.6 and 27.3 GiB |
| Revision 2's T2 played plain, for V2's starting stock | 1,315,363 | 11.4 min | 7.6 GiB |
| V1's T1 replayed on the whole die | 199,311 | 16.4 min | 4.9 GiB |
| 22 plays over the probe block: replays, trials, pictures, minimal programs | — | 5 s to 3.3 min each, 37 min in all | 1.2 to 4.7 GiB |
The whole-die plays took 194 min of server time; the T1 replay also waited 64 min for the lock. V1's T2 optimization play's memory was not sampled. From the first trial to the last replay, the study ran in one evening.
For a machining engineer. On a die whose finishing ball is overloaded in its own-radius corners, HiNC's optimization does three different things depending on what it is allowed. Allowed to slow the finishing to a deflection limit, it brings all but one over-limit step down to the lowest feed, and shows that in the corner even that leaves 13–24 µm: the fix there is the entry or the tool, not the feed. Its extended windows then make the die 92 % slower, because a step at the minimum slows the path around it too. Without windows the die is 26.5 % faster, but on a grid coarser than the finishing allowance the model misses loads, and the rest roughing bends 89.5 µm. Kept from going below the hand-revised program, it takes 24.5 % off that program, a fifth of it in the roughing, and leaves its peaks where they were. The roughing gains 36.6 % in every case, at a ceiling the agent chose. And the optimized file needs checking against its source lines: a split line can carry points off its path.
For a teacher or a student. One die shows what a feed optimizer holds and what it does not: it has no deflection criterion built in, so a limit must be carried by a criterion it does hold — here tool stress, which comes from the same bending moment. It shows how the windows that smooth the feed spread a single slow step over 4 mm, why a grid coarser than the allowance makes a fast optimization untrustworthy, and why some peaks are geometry, not feed.
For someone weighing the approach. From three accepted programs and two hand revisions to three optimized variants took one evening: nine whole-die plays and 194 min of server time at up to 46.3 GiB, and 22 light plays over a probe block. The agent wrote its criteria and its decision rules first, found on a trial that the force target did not act on ramps and moved the limit to tool stress before the first whole-die play, added the variant that explains its own miss, and reported the criteria that failed. What it leaves to an engineer is the corner entry, and whether to accept 24.5 % on the hand-revised programs.
Honest limits
- The force target does not lower the feed on ramps and plunges. On nearly all of those steps it allows the upper bound; on level steps it holds. The deflection limit is therefore carried by the tool-stress criterion, through each operation's yield factor.
- Deflection is HiNC's tool-beam reading, not a measurement, and the removal geometry here does not include it: the plays run with HiNC's deflection transformation off, so the shape comparison reads the programmed path.
- No feed brings the corner under 12.5 µm. At the 100 mm/min minimum the R1.5 ball still bends 13 to 24 µm there; the entry or the tool has to change.
- The corner's loads may read high. HiNC can over-read a small cutter's load where it meets a corner head-on — the injection-mould case found 3.3–6.8 times a straight cut's load where the real section is 1.6–1.8 times — and this study did not measure the real section in this corner. That no feed brings these steps under 12.5 µm is HiNC's reading; the real bend there may be smaller.
- The extended windows act after each step is solved, and hold 2 mm on each side of a slow step at its feed; with many steps at the minimum the program grows long.
- The grid is coarser than the finishing allowance. The optimization ran at 0.125 mm against T3's 0.04 mm; the deflection verdicts come from the probe block at the corner only. Elsewhere the whole die at 0.125 mm reads larger loads in places — the first programs' T3 shallow finishing at a 99th percentile of 156 N and 88.8 µm — which were not judged on a finer grid.
- An optimized file can carry points off its programmed line. Where the optimizer splits a line and an axis moves by no more than 0.0001 mm in a fragment, the fragment keeps the source line's end value on that axis: up to 8.6 µm here, about 0.14 mm on a 100 mm line. Check the optimized file against its source lines before it goes to a machine.
- The optimized T2 and T3 programs were not replayed on the whole die, and no exported stock was measured against the design (O3(b)); their shape is the agent's z-map comparison and their times the z-map arithmetic, which matched HiNC wherever HiNC played the program.
- The times are ideal-feed estimates, without the controller's acceleration and look-ahead: the ratios between versions are sound, the absolute times are not shop-floor times — see Machining Time Estimation.
- The gain rests on the agent's ceilings, 1.5 times the roughing feed per tooth, not a maker's data.
- Chip evacuation, chatter and surface finish are not modelled. Only the lower die was played; the upper die is the same shape and program.
- The machine, spindle and tools are generic, and the loads come from HiNC's library coefficients for the chosen die steel; nothing was measured on a machine.
What a reader can take to their own case
- Carry a deflection limit on a criterion that acts on every step. Here the force target did not act on ramps and plunges; tool stress, from the same bending moment, did.
- Check that a cap caps. Compare the feed each criterion allowed in the per-step log with each step's load before optimizing; a target that never binds looks exactly like one that does.
- When the lowest feed still leaves a step over its limit, change the path, not the feed. Read which steps sit at the minimum and where they are.
- Count what the extended windows cost. A step at the minimum slows the window around it; a long program with many such steps can end slower than its source.
- Do not drop the windows on a grid coarser than the allowance without checking the result on a finer one; here that let 89.5 µm through.
- Floor a proven program at its own feed when its slow steps were chosen on purpose: the source-feedrate floor at 100 % took 24.5 % off the hand-revised programs and kept their peaks.
- Check the optimized file against its source lines before it goes to a machine.
- Write the decision rules before the trial that decides them, and report a missed prediction with its cause.
- Budget the memory. An optimization play can need several times what its replay does: 46.3 GiB against 4.9 GiB for T1.
Source and licence
- Source: Anna Dziubińska (Warsaw University of Technology), “The New Technology of Die Forging of
Automotive Connecting Rods from EN AB-71100 Aluminium Alloy Cast Preforms”, Materials 2023, 16(7),
2856, doi:10.3390/ma16072856 (PMC10095791). Search terms if the
link moves:
Dziubińska 2023 connecting rod EN AB-71100 die forging,ma16072856. - Licence: CC BY 4.0. The article states: “Copyright: © 2023 by the authors. Licensee MDPI, Basel, Switzerland. This article is an open access article distributed under the terms and conditions of the Creative Commons Attribution (CC BY) license (https://creativecommons.org/licenses/by/4.0/).” The licence gives the material as is, without warranty. No endorsement by the author or the publisher is implied.
- Attribution: “Forging drawing and die photograph: A. Dziubińska, Materials 2023, 16, 2856, doi:10.3390/ma16072856, CC BY 4.0. Die design and machining set-up by Tech Coordinate's agent.”
- What was used and changed: the article gives the forging drawing, its volume, the process temperatures and the photograph of the dies; the die's case page tells what the agent made of them. The die, its material, the machine, the tools, the programs and their optimization here are the agent's. This page reproduces no figure of the article: the pictures are HiNC simulations of the agent's die, and the charts are drawn from HiNC's per-step results and the agent's own z-map. This site offers no download: the reader fetches the article from the publisher.
See Also
- Connecting-Rod Forging Die — how the forging, the die and the programs optimized here were made and accepted
- NC Optimization — what the optimizer holds, the windows and the source-feedrate floor
- Workflow: NC Optimization — the settings, settings embedded in the program and the per-step log
- Optimization Results — measured before-and-after comparisons on other parts
- Machining Time Estimation — why the ratio of two simulated times is the part to trust
- Showcase — the other cases and how a case page reads