Optimization Results
Two measured before-and-after comparisons. Both were run on real machines with the same cutter and the same geometry, changing only the feed rates in the NC program.
Hardened Mould, 3-Axis — FDAC
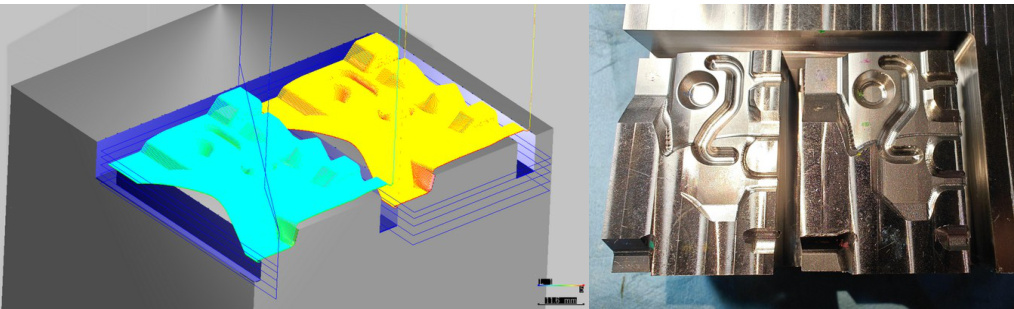
Bull nose cutter
| Fixed feed | Optimized feed | |
|---|---|---|
| Feed rate | 120 mm/min | variable |
| Expected machining time | 303 min | 95 min (31%) |
| Tool breakage | at 217 min | none |
The time figure is the headline, but the breakage row is the result worth having: the fixed-feed run did not complete. An optimized program that finishes is not comparable to an unoptimized one that does not.
Ball cutter
| Fixed feed | Optimized feed | |
|---|---|---|
| Feed rate | 220 mm/min | variable |
| Machining time | 125 min | 74 min (59%) |
| Measured wear depth | 50 µm | 20 µm (40%) |
The wear depth here is measured on the cutter, not simulated:
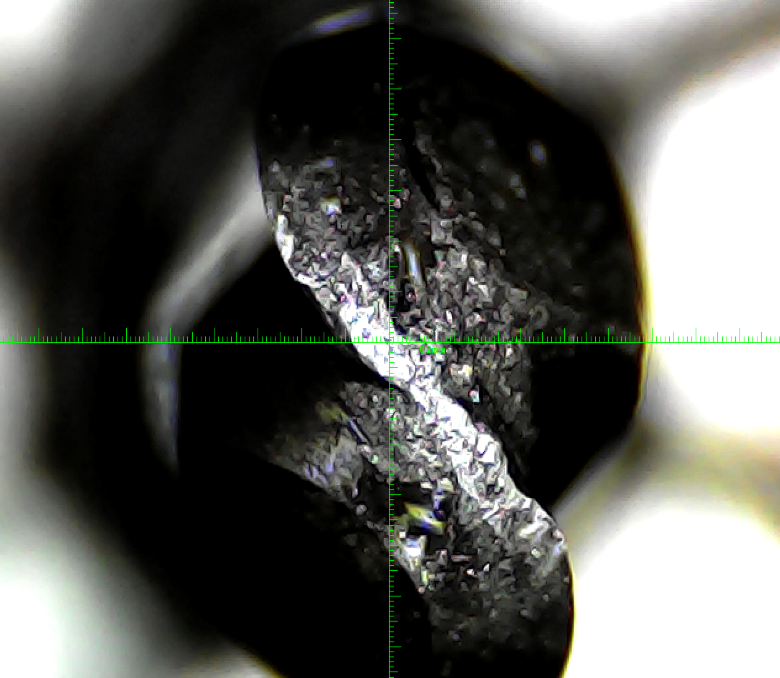 Fixed feed
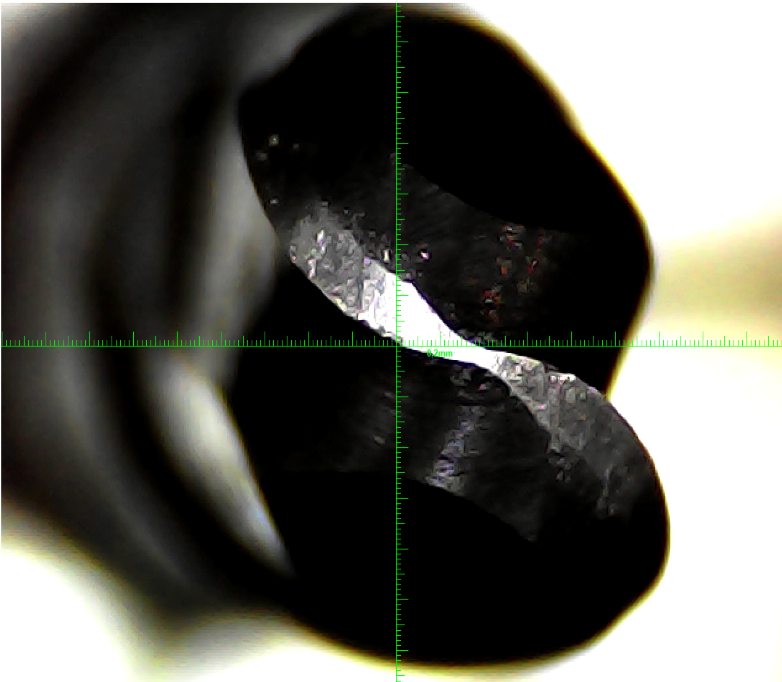 Optimized feed
Free-Form Roughing, 5-Axis — Ti6Al4V
Simulated comparison on a five-axis free-form roughing program in titanium:
| Original NC | Optimized NC | |
|---|---|---|
| Machining time | 181 s | 79 s (56% reduction) |
| Tool wear | 13.1 µm | 8.9 µm (32% reduction) |
| Breakage risk | high, from overcut; low yield | overcut breakage eliminated |
Both figures here are simulated rather than measured, and should be read as such — the comparison is sound because both sides come from the same model, which is the same argument that applies to the quoted times.
Reading These Numbers
The times are ideal-feed estimates and omit controller dynamics on both sides of every comparison, so the ratio is the trustworthy part and the absolute is not — see Machining Time Estimation.
See Also
- NC Optimization Principles — what the optimizer changed to produce these reductions
- Machining Time Estimation — why the ratio in these tables is sounder than the absolute