NISTIR 6868 test part: the X–Y squareness a laser ball bar measured on its machine, cut into the part, sets the two rows of holes 6.87″ out of square and the slot 1.64 / 1.69 µm out of round (3-axis)
- Original source
- David E. Gilsinn (NIST, Mathematical and Computational Sciences Division) and Alice V. Ling (AFRL/DEX, Kirtland AFB), Comparative Statistical Analysis of Test Parts Manufactured in Production Environments, NISTIR 6868, National Institute of Standards and Technology, June 2002 — DOI 10.6028/NIST.IR.6868 (PDF at NIST, a scan of the printed report). The report publishes no CAD, NC program or data set; it prints its measurements in tables. The case uses the part of Figure 2 and Tables A1–A3, the machine's travels (section 3.1), the X–Y squareness of Table 1 and the other error trends of Table 2, and, for the comparison, the model's predictions (Tables 5–8 and 17) and the CMM results of the 21 parts (Tables 13–16).
- Search keywords
NISTIR 6868,Comparative Statistical Analysis of Test Parts Manufactured in Production Environments,Gilsinn Ling laser ball bar test parts CMM- Licence
- NIST's statement for its Technical Series publications, read on 2026-10-07 under the
heading "NIST Technical Series Publications" of NIST's
copyright, fair use and licensing statements,
verbatim:
In accordance with Public Law 100-519, Section 107 (Oct 24, 1988), NIST maintains a research information center to support the research, publishing, and preservation needs required to fulfill the scientific and technical mission of NIST. This includes publishing the NIST Technical Series: technical reports and Journal of Research of NIST. Works authored by NIST employees are not subject to Copyright protection within the United States; foreign rights are reserved. To the extent NIST may assert rights outside of the United States, the public is granted the non-exclusive, perpetual, paid-up, royalty-free, worldwide right to reprint works in all formats including print, electronically, and online, and in all subsequent editions, and derivative works. Please use the recommended citation format below followed by 'Republished courtesy of the National Institute of Standards and Technology.' Some works published by NIST may have been written by third parties and may be subject to copyright protection.
The report prints no copyright line. Its first author was at NIST; the second is listed at AFRL/DEX, an Air Force laboratory, and whether that part of the work was written as a federal employee could not be found. So the statement's last sentence may apply to part of the text, and the case uses only what no licence restricts: the report's numbers and part dimensions, and a few short quotations with their section numbers. This page reproduces no figure, table or page of the report. The part is redrawn by Tech Coordinate, and every picture is a HiNC capture or a chart drawn from HiNC's results and the report's numbers. - Attribution
-
Measured data and part dimensions: D. E. Gilsinn, A. V. Ling, "Comparative Statistical Analysis of
Test Parts Manufactured in Production Environments", NISTIR 6868, National Institute of Standards and
Technology, Gaithersburg MD (2002), https://doi.org/10.6028/NIST.IR.6868. Republished courtesy of the
National Institute of Standards and Technology. Changes: the part model, the NC programs, the tools
and the HiNC project are Tech Coordinate's, built from the report's drawing and tables; the plate's
size, the band beside the square and the outer holes' drilled depth were measured on the scanned
drawing, and the four small bosses inside the slot were left out; no figure, table or page
reproduced.
Tech Coordinate's agent added one error-term branch to the simulated machine, directly upstream of the Y axis, with the mean of Table 1, and derived its sign and its pivot. NIST and the authors do not endorse Tech Coordinate, HiNC or this case. - About the case
- A production machine shop cut 21 copies of one test part on one three-axis vertical machining centre (travels 1020 × 762 × 560 mm; make, model and controller not given). The machine was measured with a laser ball bar first: the angular error between its X and Y axes, its squareness, in five passes, −6.99, −6.43, −7.39, −6.76 and −6.79″, mean −6.872″ (Table 1). The 21 parts were then measured on a CMM: the orthogonality fitted through two rows of milled hole centres, −1.06″ on average, and the roundness of a circular slot's inner and outer edges, 21.0 and 26.0 µm. The part is a plate with an inner 150 mm square standing 7 mm high, 24 holes along its sides, drilled 3/8 in (9.525 mm) and squared to 12 mm with R4.7625 corners, and a circular slot from R44.5 to R55.5 about the square's centre; the square's walls, the squared holes and the slot all reach 7 mm down. The report has no CAD and no NC, so, as with the roundness test part, there is no accepted case to build on: the agent built the part, the programs and the base project from the report's drawing and tables first, then put in the error. The simulated machine is HiNC's shapeless three-axis skeleton with the report's travels, not the one they measured; it borrows its X–Y squareness.
The story
An AI agent asked for error-term showcases, paper cases welcome, took up this report, whose error and part come from the same machine: the laser ball bar measured the machining centre that cut the 21 parts. So the part cut in simulation can be read with the report's own method, the orthogonality from two rows of hole centres (equations 42–44) and the hole distances of Table 13, and set beside the report's model and its CMM.
The report gives a scanned drawing and tables, but no plate size or thickness, no drilled depth for the outer holes, no material, tools, cutting data, order of operations or fixture. Through HiNC's web API the agent built the base project: the part redrawn from Figure 2 and Table A1, four Fanuc programs of its own, a 3/8 in drill (T1) and a 3/8 in end mill (T2) in ER32 collet chucks, and Al6061-T6. T1 drills the 24 holes. T2 mills the band around the square in two layers, squares the 24 holes and mills the slot from a helix on its centre line, the inner edge counterclockwise and the outer edge clockwise, as section 5.4 of the report says. A 1 mm play accepted it: no collision, no rapid move into the stock, and every feed move cutting except the plunges in air, the descents into drilled holes and the returns to the centre.
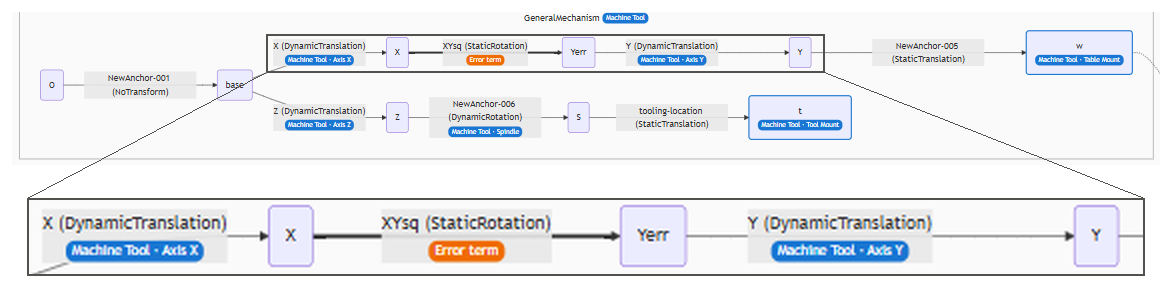
Then the agent put the error in, on a branch of its own marked as an error term, directly upstream of the Y axis: a static rotation about Z of −6.872″, the mean of Table 1. This skeleton carries Y on X, where the report's machine carries X on Y; the angle between the two motions, which is what the part records, is the same either way. Here the part sees it as an X travel tilted toward +Y: the tool reaching program X lands k·X further in +Y, with k = 3.3316×10⁻⁵, 33.3 µm per metre. The controller solves its axes as if the marked branch were not there. The simulated machine still moves and cuts with it whenever the project's Enable Error Terms switch is on, like a real machine whose controller does not know its squareness. The pivot sits where the tool axis stands when the operator touches off at program zero, so the G54 a real touch-off would find, (−585, −456, −561), stays as it is.
Before the first play, the agent committed a plan with the tool-tip offset it expected, the deviation of every feature and twelve pass criteria. It then played the four programs, unchanged, on a coarse 1 mm grid and on a 0.25 mm grid, geometry only:
- error terms off: the nominal cut, which every comparison is measured against;
- off again, with HiNC's geometry difference (Diff) against the nominal cut: the noise floor;
- on, with the error marked, so the controller does not know it.
A fourth run at 1 mm cleared the mark, as a controller with calibrated kinematics would know the error.
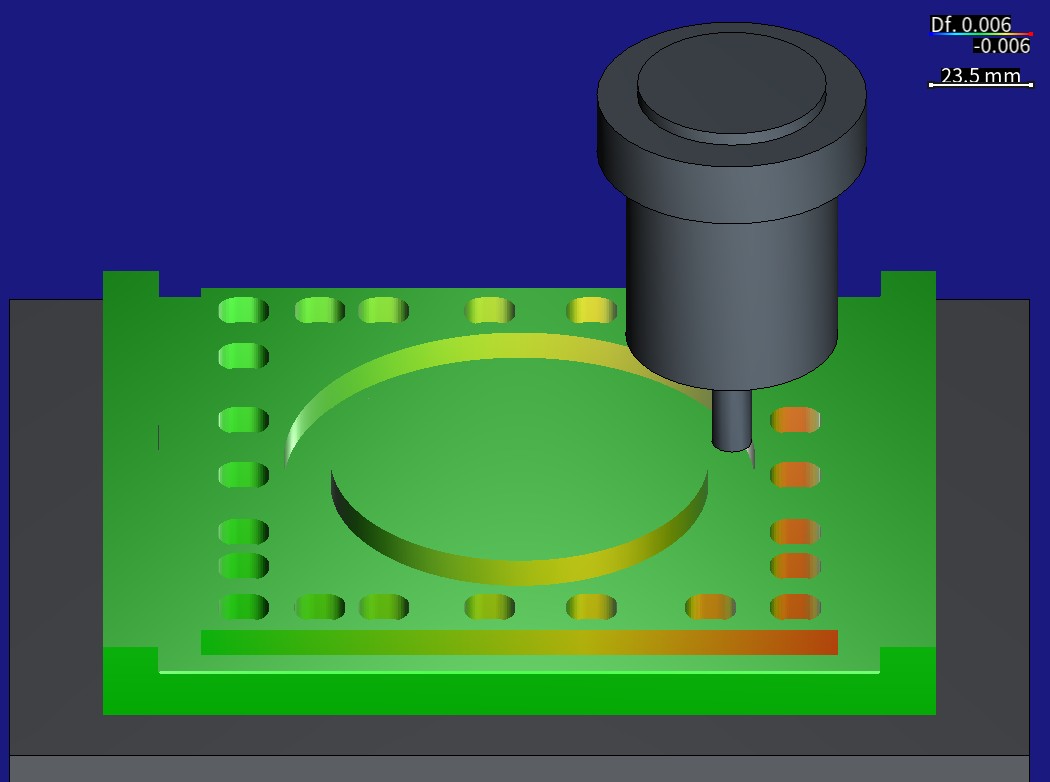
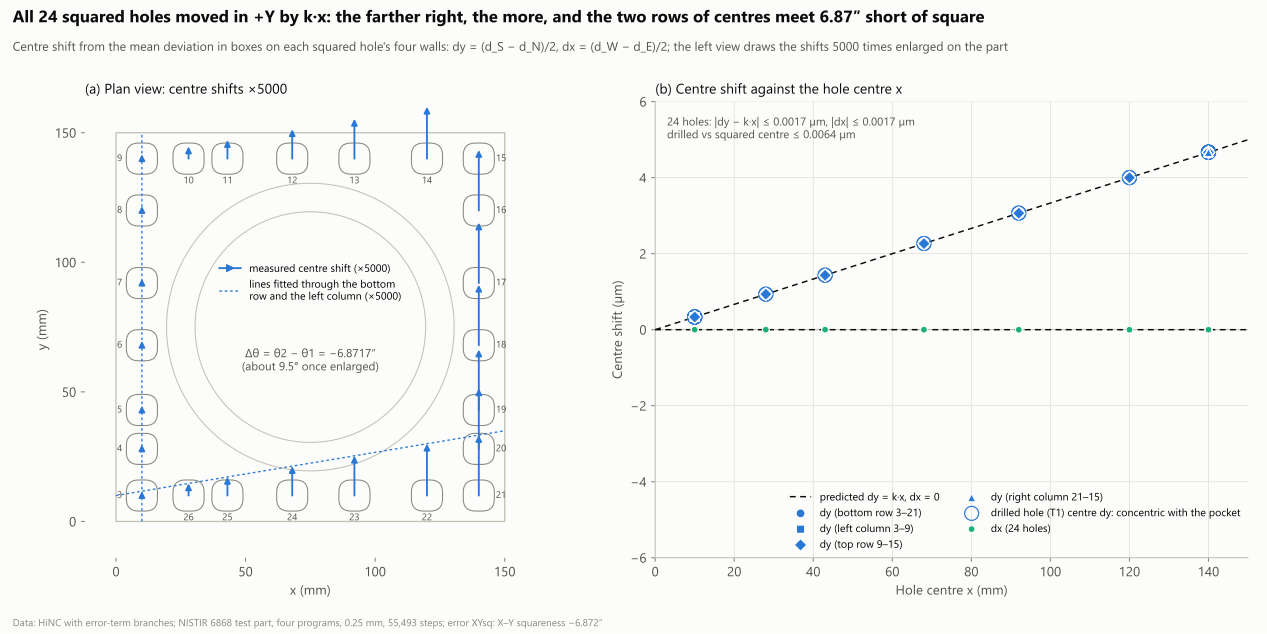
HiNC rendered these pictures on the agent's simulated machine with the error-term branch it built in; the part is the agent's redrawing of the report's Figure 2 and Table A1, and the error value comes from the report's Table 1. The cut parts were put back on the canvas with their Diff, not replayed; for the first picture, a parking program brought the tool into view without cutting. The colours are HiNC's geometry difference (Df in the colour bar) against the part the nominal run cut, on a symmetric scale of ±0.006 mm: red = cut too deep, blue = material left, green = 0. The grid is 0.25 mm. The hole chart is drawn from the cut part's mesh.
| Key number | What it is |
|---|---|
| −6.872″ · 33.3 µm/m | the error: the X–Y squareness the report's laser ball bar measured on the machine that cut its parts, the mean of five passes between −6.43 and −7.39″ (Table 1), put in as a static rotation directly upstream of Y. Seen from the part, the tool reaching program X lands k·X further in +Y, k = 3.3316×10⁻⁵ |
| 2.07×10⁻¹³ mm | how far, at most, the measured tool-tip offset of any of the 55,493 steps lies from the formula δ = (X(cos g − 1), k·X, 0) written before the first play. The machine coordinates are bit for bit those of the nominal run |
| −6.8717″ | the orthogonality the cut part gives back by the report's own equations 42–44, from the bottom row and the left column of hole centres (−6.872″ put in). Each of the 24 hole centres moved by k·x in +Y, from 0.333 µm at x 10 to 4.664 µm at x 140, within 0.0017 µm of the prediction |
| −4.96 / +4.95 µm | the 150 mm square's south wall cut too deep and north wall left thick at x 148–150, both growing in proportion to x, while the west and east walls stay at 0: a parallelogram 6.87″ out of square |
| +3.061 µm | how much the diagonal hole distance 3→15 grew (+3.063 µm predicted); the distances along the two rows, 3→9 and 9→15, changed by −0.001 µm |
| 1.640 / 1.691 µm | the slot's simulated roundness, inner and outer wall: an ellipse on top of a 2.50 µm shift in +Y. Predicted at the cutter-centre radii, 1.641 / 1.690 µm; against the plan's 1.483 / 1.849 µm, computed at the walls' radii, the slot criterion failed as written on the inner wall |
| 5.8″ · 0.32 | the gap between the simulated orthogonality and the CMM mean of the report's 21 parts (−1.06″), 3.7 µm over 130 mm, and its share of the CMM's expanded uncertainty of 18.1″: inside the uncertainty, not a match |
| 7.8 % · 6.5 % | how much of the slot roundness the CMM measured on the inner and outer edge (21.0 / 26.0 µm) this one squareness gives: under a tenth |
| 420.3 s | server time for all seven plays, 55,493 steps each. On the shared 32-thread server, each 0.25 mm play took about 100 s and at most 2.99 GB of memory |
Four of its eight dilemmas
A part redrawn from a scan
The report gives a scanned drawing and tables: no CAD, no NC, and no plate size or thickness, drilled depth of the outer holes, material, tools, cutting data, order of operations or fixture. Rebuilt differently, the orthogonality, the slot and the hole distances would no longer be the same thing as the report's. The agent used every labelled dimension and table as printed: the 150 mm square, the hole centres of Table A1, the 12 mm squared holes with R4.7625 corners, the slot's R44.5 and R55.5 about (75, 75), the 7 mm level of section AA. It measured the plate's size, the band beside the square and the outer holes' drilled depth on the scan, against the labelled dimensions; the scan is stretched, 5.73 px/mm across and 5.09 px/mm down. The four small bosses inside the slot were left out, since no comparison of the report uses them, and a 3/8 in end mill gives the drawing's R4.7625 corners with its own radius. Every value is marked as read, derived, chosen or measured, and the three features the report compares follow the drawing.
Which way the sign goes
The report's α is −3.33×10⁻⁵ rad, −6.87″. Its model carries X on Y and HiNC's skeleton Y on X, so which sign a rotation about +Z upstream of Y needs, for the part to read the report's sign, had to be derived from both sides' definitions. With the wrong sign the part would read +6.87″, opposite to the report's model and its CMM, and every comparison with the report would be wrong. The report writes the squareness as E_x = −y·α (equation 9) and the orthogonality as Δθ = θ2 − θ1 (equations 42–44); recomputing the report's whole model from Table 2 gives Table 5's −5.10″, which confirms the reading. On this skeleton a rotation g upstream of Y gives the part Δθ = +g, so g = α = −6.872″. A draft had +6.87″; it was wrong and never played. The cut part reads −6.8717″, the sign of the report's model and of the CMM mean.
A pivot where the touch-off is
Where a static rotation turns decides how far it moves the whole part. A touch-off on the real machine puts into G54 whatever the error shifts at that pose; HiNC's P0 measures on the machine the controller knows and puts in nothing. With the pivot elsewhere, the part would have shifted as a whole, and the Diff would have charged the missing touch-off to the error. So the pivot sits where the tool axis stands at the touch-off on program zero, (−585, 0, 0) in the X anchor's frame: program zero does not move, and a real touch-off still finds G54 (−585, −456, −561). While the error was marked, P0 read exactly that, the switch on or off. With the mark cleared, it read X 15.19 µm off: P0 takes program zero in the tool-end frame at machine zero and does not solve the chain at the touch-off pose. At machine zero Y is 0, program zero lies 456 mm from the pivot line, and 456 mm × 3.3316×10⁻⁵ is 15.19 µm. So the on and unmarked runs typed (−585, −456, −561) in, as HiNC's manual advises for reproducing a shop's cut.
The plan's radius, not the cutter's
The plan predicted the slot's ellipse with the walls' radii, 44.5 and 55.5 mm: b2 +0.741 and −0.925 µm, a simulated roundness of 1.483 and 1.849 µm, each to ±10 %. The inner wall measured b2 +0.8199 µm (0.667–0.815 allowed) and 1.640 µm (1.334–1.631 allowed): failed as written. The outer wall passed, yet came out 8.6 % off the plan the other way. The tool-tip offset depends only on the x of the cutter centre, and each point of a wall is cut when the cutter centre stands at the same azimuth, on a circle 4.7625 mm from the wall into the slot: 49.2625 and 50.7375 mm in the program. With those radii the prediction is b2 +0.8206 and −0.8452 µm, met within 0.0008 µm. The verdict stays as written, and the corrected prediction is recorded as a finding about the plan. The RPTU part 8 case had already written the same thing; this plan did not use it.
The full record has the other four: the licence question, since a search could not establish whether the second author's part was written as a federal employee, which is why no figure or table of the report is reproduced; 14 vertices on the uncut bottom face that the distance search read 5.9–7.3 mm off in the control run, all 0 against every triangle; a small local reading where the inner slot pass starts and ends, recorded but not explained; and the floor of the mesh-distance method, the chord height on the R4.76 corners and 32-bit coordinates.
The result
All seven plays ran to the end, 55,493 steps each, with no collision.
With the error on and the controller unaware of it, the tool tip of every step sat where the formula written before the first play put it, δ = (X(cos g − 1), k·X, 0), within 2.07×10⁻¹³ mm. Moving along X, the tip drifts toward +Y by 33.3 µm per metre, from zero at program zero, where the touch-off is; on the cutting steps the drift runs from −0.17 to +5.17 µm, the largest on the pass along the right flange wall (cutter centre x 155.24). Every step's machine coordinates are bit for bit those of the nominal run, and the control run repeats the nominal run bit for bit.
On the part, each of the 24 squared holes moved bodily in +Y, by k times the x of its centre: 0.333 µm at x 10 and 4.664 µm at x 140, each within 0.0017 µm of the prediction, and in x within 0.0017 µm of zero. Fitted by the report's own equations 42–44, through the bottom row and the left column of centres, they give Δθ = −6.8717″ against the −6.872″ put in; the opposite corner gives the same. The diagonal 3→15 grew by 3.061 µm and the other diagonal shrank by 3.064 µm, while the distances along the rows, 3→9 and 9→15, changed by −0.001 µm. The drilled holes moved with their squared pockets, within 0.0064 µm: the drill and the end mill stand at the same program x, so the comparison of milled and drilled hole centres the report designed the squared holes for (section 3.2) cannot see a squareness.
The 150 mm square became a parallelogram 6.87″ out of square. Its south wall is cut too deep and its north wall left thick in proportion to x, −4.96 and +4.95 µm in the 2 mm at x 148–150, with slopes of −0.03334 and +0.03332 µm/mm against ∓0.03332 predicted; the west and east walls read within ±0.062 µm.
The slot moved 2.50 µm in +Y and became an ellipse: a simulated roundness, the peak-to-valley of its second harmonic, of 1.640 µm on the inner wall and 1.691 µm on the outer, against 1.641 and 1.690 µm predicted at the cutter-centre radii.
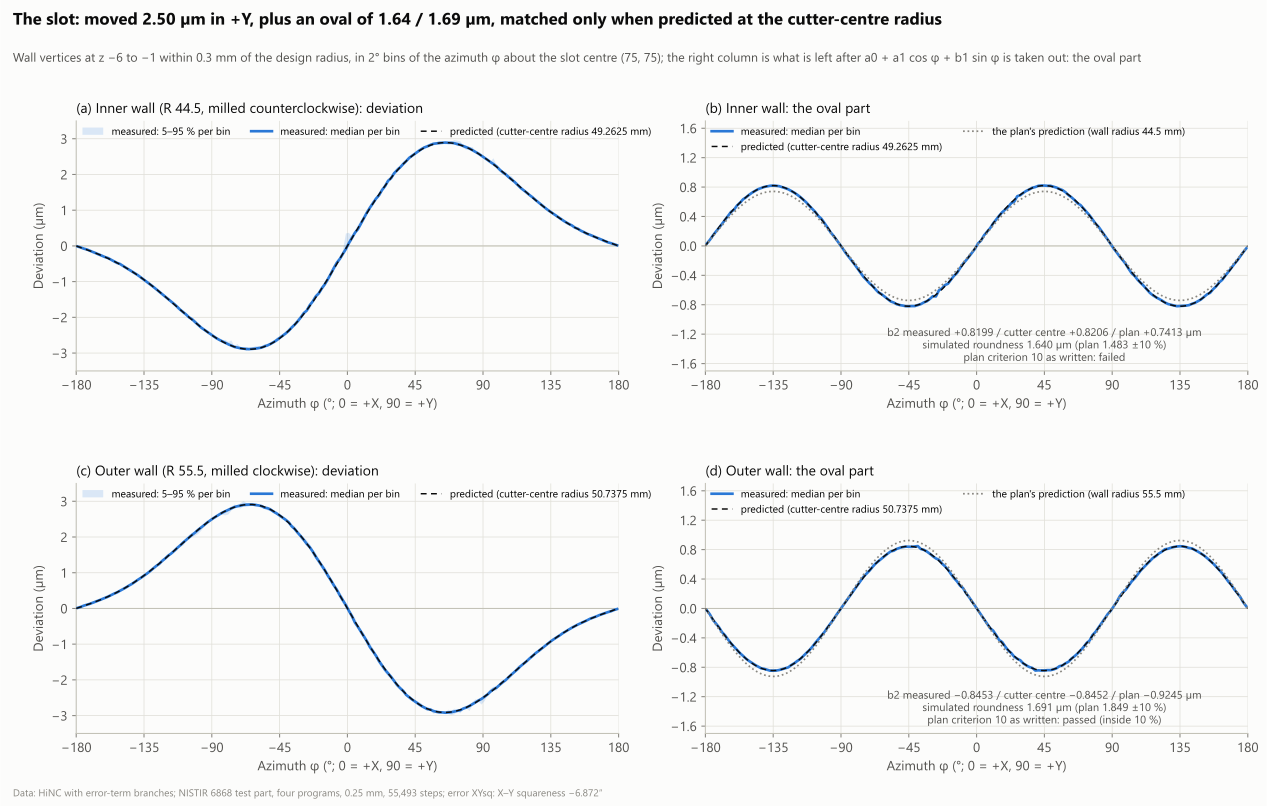
All 84 feature boxes fixed before the play held their predicted means within tolerance; the largest gap, 0.101 µm, lies where the inner slot pass starts and ends. The control cut equals the nominal cut at every vertex within 5×10⁻¹⁰ mm; the 14 vertices the distance search read far off are 0 against every triangle.
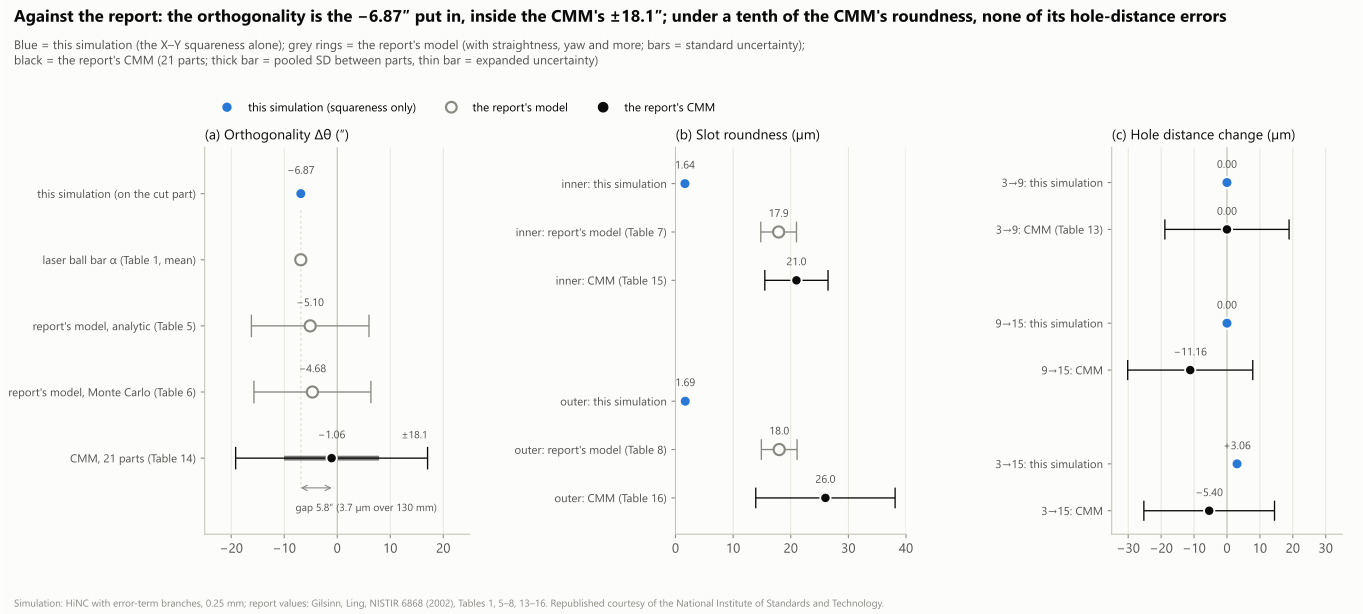
Against the report: the simulated part's orthogonality is the squareness put in, to 0.0003″, so the case does not validate the report; it cuts one of the errors the report measured into the part on its own, to see how much of the result it explains. The CMM mean of the 21 parts, −1.06″, lies 5.8″ away (3.7 µm over 130 mm), 0.32 of its expanded uncertainty of 18.1″: inside the uncertainty, not a match. The report's own model, −5.10″ analytic and −4.68″ by Monte Carlo, carries straightness and yaw as well, and the report concludes that "the model estimates over-predicted the orthogonality error but did produce the same direction of error" (section 6.3). Section 5.3 words the CMM's calculation as a sum of the two slopes rather than equation 44's difference; read that way, the part would give +6.87″, 7.93″ from the CMM mean and still inside the uncertainty. On the slot, the squareness alone gives 1.64 / 1.69 µm, 7.8 % and 6.5 % of the 21.0 / 26.0 µm the CMM measured and 9.2 % and 9.4 % of the model's 17.9 / 18.0 µm; the two roundness measures are defined differently, so compare sizes only. Among the hole distances it changes only the diagonal, by +3.06 µm. The CMM's −11.16 µm on 9→15 runs along X, and the report's X scale error (Table 2) alone shortens that length by 2.46 µm; the report's model gives negative values for all three distances too (−2, −3 and −1.8 µm, Table 17). All three lie within the uncertainty of about 19 µm the report gives with them. Heat and the other errors are outside this model.
With the mark cleared, as a controller with calibrated kinematics would know the error, the 1 mm run cut the same part as the marked 1 mm run, bit for bit: the tool tip, the machine coordinates and the 54,834 vertices of the cut. These are plain three-axis G54 / G43 programs, and the controller computes the machine coordinates from the program, the work offset and the tool length alone, so the squareness is cut in either way. What a controller that knows the error could take back would show only under RTCP, a tilted working plane or a CL playback, which this case does not have.
The study models one constant error only. The report's model also carries the X and Y scale errors, straightness and yaw, which vary with position and do not fit a constant error term; heat, cutting force, clamping and burrs are not modelled either. So the case measures what this one error cuts on its own, not a rebuild of the 21 parts. The machine is HiNC's shapeless skeleton with the report's travels. The plate, the band and the drilled depth were measured on a stretched scan, and the tools, holder, material, fixture and programs were chosen. The plays are geometry only, with no cutting force or deflection. Everything is simulated; no part was cut, and none of the report's 21 parts was used.
What it brought
- For a machining engineer: the X–Y squareness of a production three-axis machine, −6.87″ or 33 µm per metre, cuts at most about 5 µm into this 150 mm part: the square's south wall 4.96 µm too deep at x 150, its north wall 4.95 µm thick. A squareness shows on the part as its angle times the X travel a feature spans, from zero at the touch-off point: the bottom row's hole centres move 0.33 to 4.66 µm, the left column's all 0.33 µm. Drilled and squared holes move together, so their concentricity does not show a squareness; fitting two rows of hole centres, or measuring the square's walls, does. On plain three-axis programs like these, a controller that knows the squareness cuts it in all the same. In HiNC, a constant error measured on a machine can go into its model, to see its shape and size on your own part before anything is cut.
- For a teacher or a student: how the tool-tip offset follows from the machine's chain, where a rotation about Z upstream of Y shows on the part as an X travel tilted toward +Y; how the report defines its orthogonality (equations 42–44) and reads 6.87″ back off two rows of holes, and why 6.87″ comes to only 5 µm over 150 mm; why the slot comes out as a shift plus an ellipse, sized by the cutter-centre radius rather than the wall's; and why the simulated roundness is under a tenth of the CMM's: a real part also carries scale errors, straightness, heat, cutting and measurement.
- For someone deciding whether to use an agent with HiNC: a scanned report from 2002 became a base project, an error-term copy of it and seven plays in one day: 420.3 s of server time in all, at most 2.99 GB of memory a play. The formula and the predictions were written before the first play and met to 2.07×10⁻¹³ mm on the tool tip, 0.002 µm on the hole centres and distances, 0.0003″ on the orthogonality and 0.007 µm on the square's wall boxes. Where the prediction missed, the record says so: the slot criterion failed as written, because the plan used the wrong radius. Against the report, it says inside the uncertainty, never a match.
Read the full case record: the NISTIR 6868 test part with its machine's X–Y squareness
Another test part built from a paper's numbers alone, where an X–Y squareness also cuts the circles into ellipses sized by the cutter-centre radius: Roundness test part, three squareness errors of its machine.