Temperature and Wear Validation
Temperature and wear sit two steps downstream of cutting force, so their agreement with measurement is a test of the whole chain rather than of one model. Both have been checked against instruments rather than against expectation.
Temperature, Against Thermal Imaging
Infrared thermography (IRT) of a running cut was compared against the simulated temperatures.
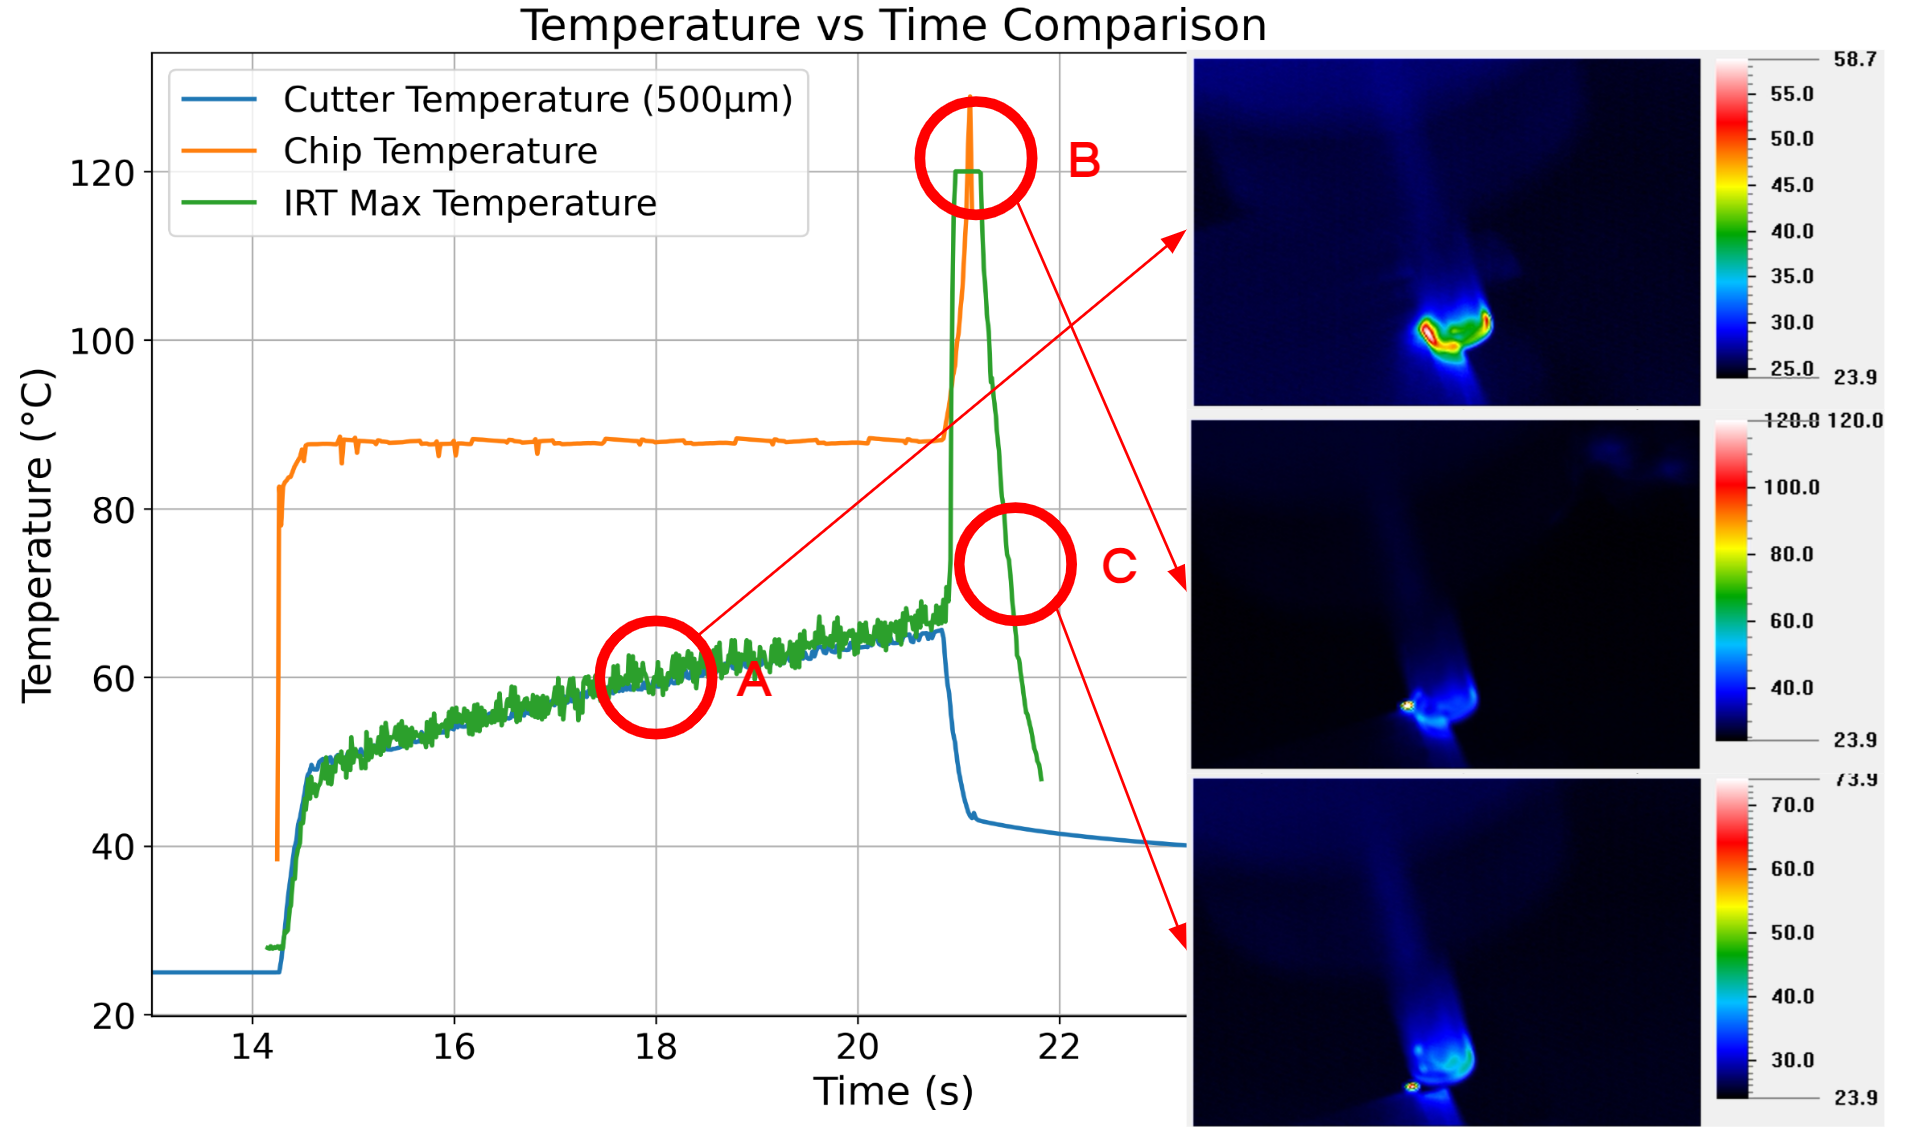
Three things the comparison establishes:
- A — the IRT-measured temperature aligns with the simulated cutter temperature at 0.5 mm depth. That depth matters: the surface reading and the body reading are different numbers, and the simulation reports both.
- B — the high temperature on the blur is an unescaped chip, and the IRT reading there matches the simulated chip temperature. What looks like a hot cutter is often a hot chip that has not left.
- C — the temperature peak in the trace originates from that blur, not from the cutting edge.
The practical consequence: a thermal measurement of a cut is not automatically a measurement of the tool. Chip evacuation has to be accounted for before an IRT reading and a simulated cutter temperature can be compared at all.
Wear, From the Same Thermal Model
Wear per revolution is computed from temperature, pressure, friction length and hardness:
Both the temperature and the hardness terms are temperature-dependent, which is why the wear figure is only as good as the thermal chain above it.
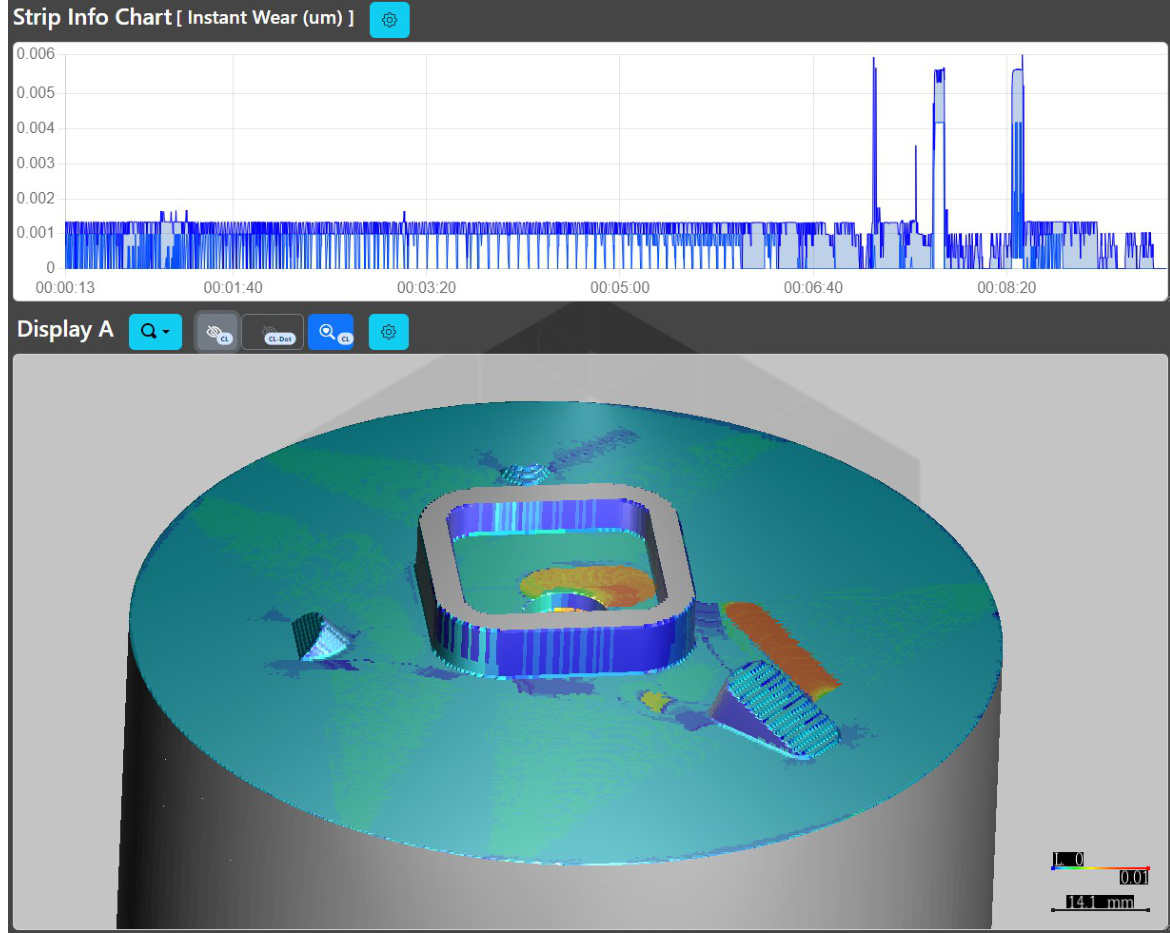
Measured against a real cutter, the depth figures hold up well enough to be used as a comparison between two programs — the 50 µm against 20 µm result in Optimization Results is a measured wear depth, not a simulated one.
See Also
- Cutting Force and Torque Validation — the quantity this chain is derived from
- Tool Life & Wear — the wear model itself, its three reported quantities, and where flank-wear width stops being valid