Cutting Force and Torque Validation
Cutting force is the quantity everything else is derived from — torque, power, deflection, heat, wear — so it is the one whose agreement with measurement matters most. The comparisons below are against dynamometer data on real cuts.
Correlation Against Measurement
For a new tool, the correlation coefficient between simulated and measured force typically falls between 0.90 and 0.999. Homogeneous brittle materials sit at the high end, usually above 0.95, because there is less in the material itself to disagree about.
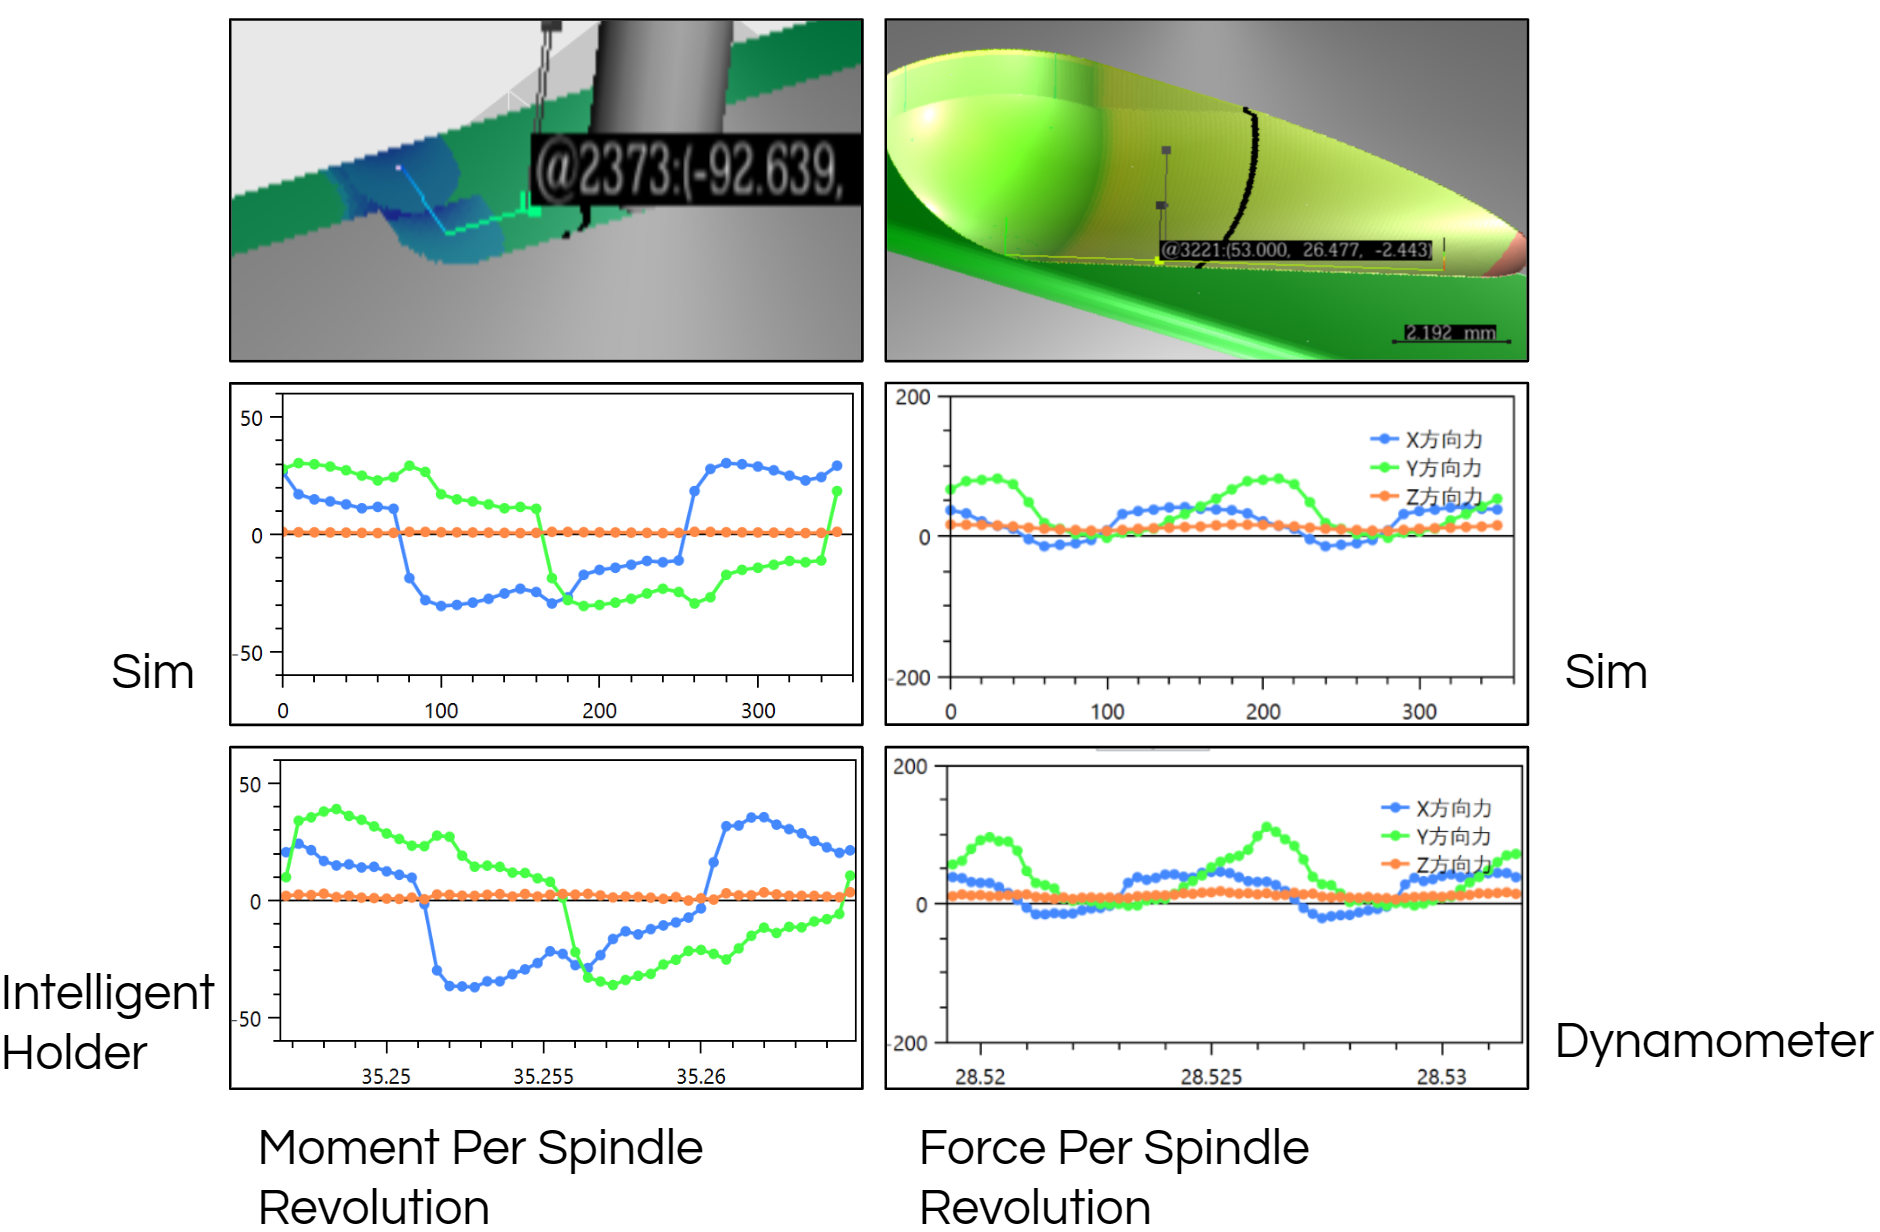
Two error ranges are worth carrying into a decision:
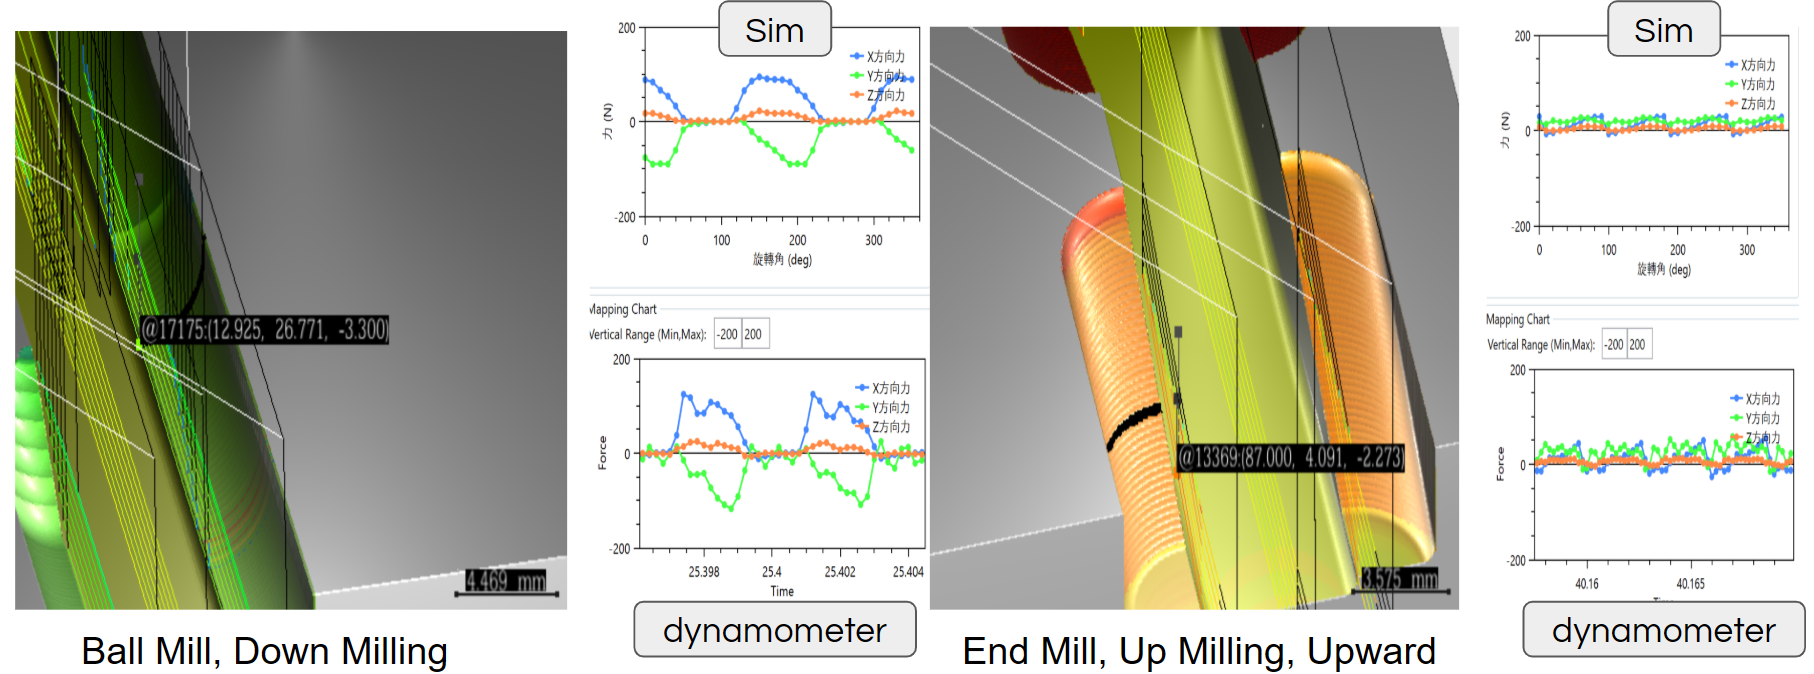
- Across tool types on the same material, expect 10%–25% error — a ball mill and an end mill trained on the same material do not land equally close. A different hone radius produces a similar range, though in rare cases it reaches 40%.
- Abnormal cutting, of the kind that loses yield on the floor, produces forces on the order of tens of times the average. That is far outside any of the error ranges above, which is what makes it detectable rather than arguable — see Cutting Force Anomaly Cases.
The waveform agrees as well as the magnitude. In the run below the machine shows Y-axis vibration that does not diverge, and the simulated waveform stays correlated with the measurement through it.
What Torque Predicts About the Surface
Torque is not only a load figure — its gradient along the surface predicts visible tool marks. When torque changes abruptly, spindle output power lags the power needed to hold speed, and the resulting speed dip leaves a mark. Cutting force deflecting the tool leaves marks by a second, independent route.
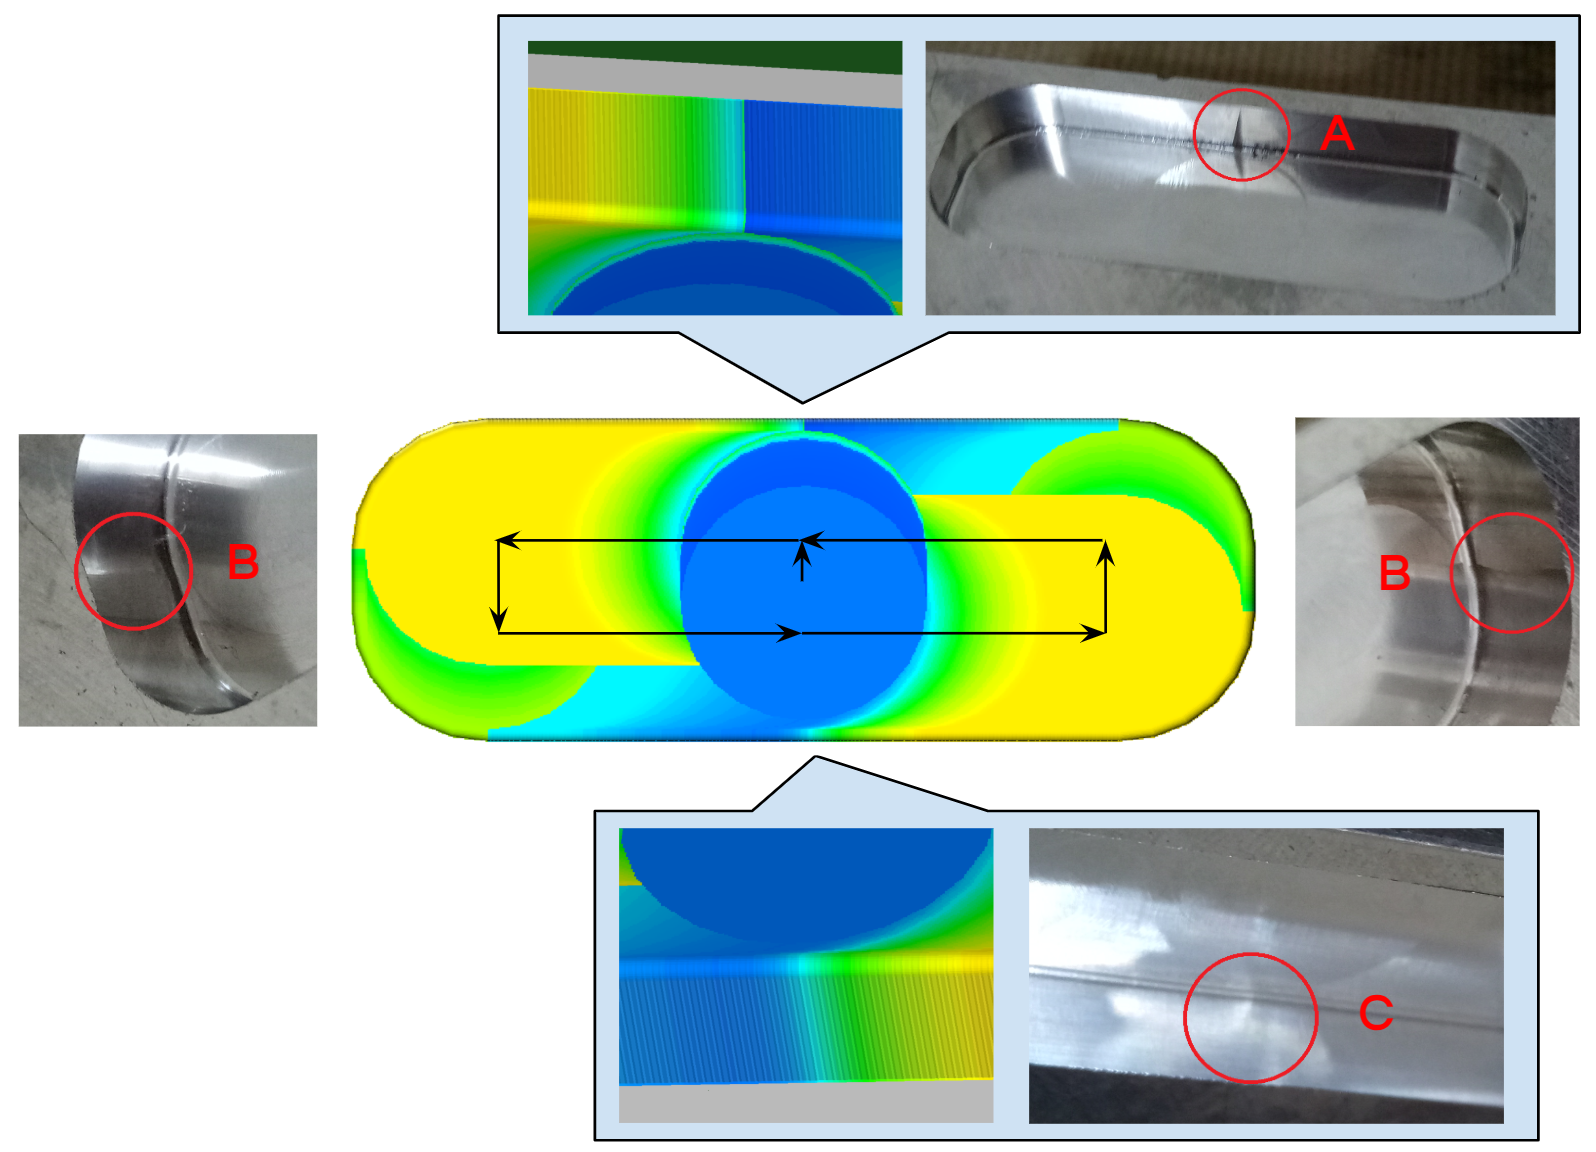
Reading the figure, where blue through red is low through high:
- A — a high torque gradient across the surface; the tool mark is obvious.
- B — marks on both sides.
- C — a low torque gradient; the mark is faint.
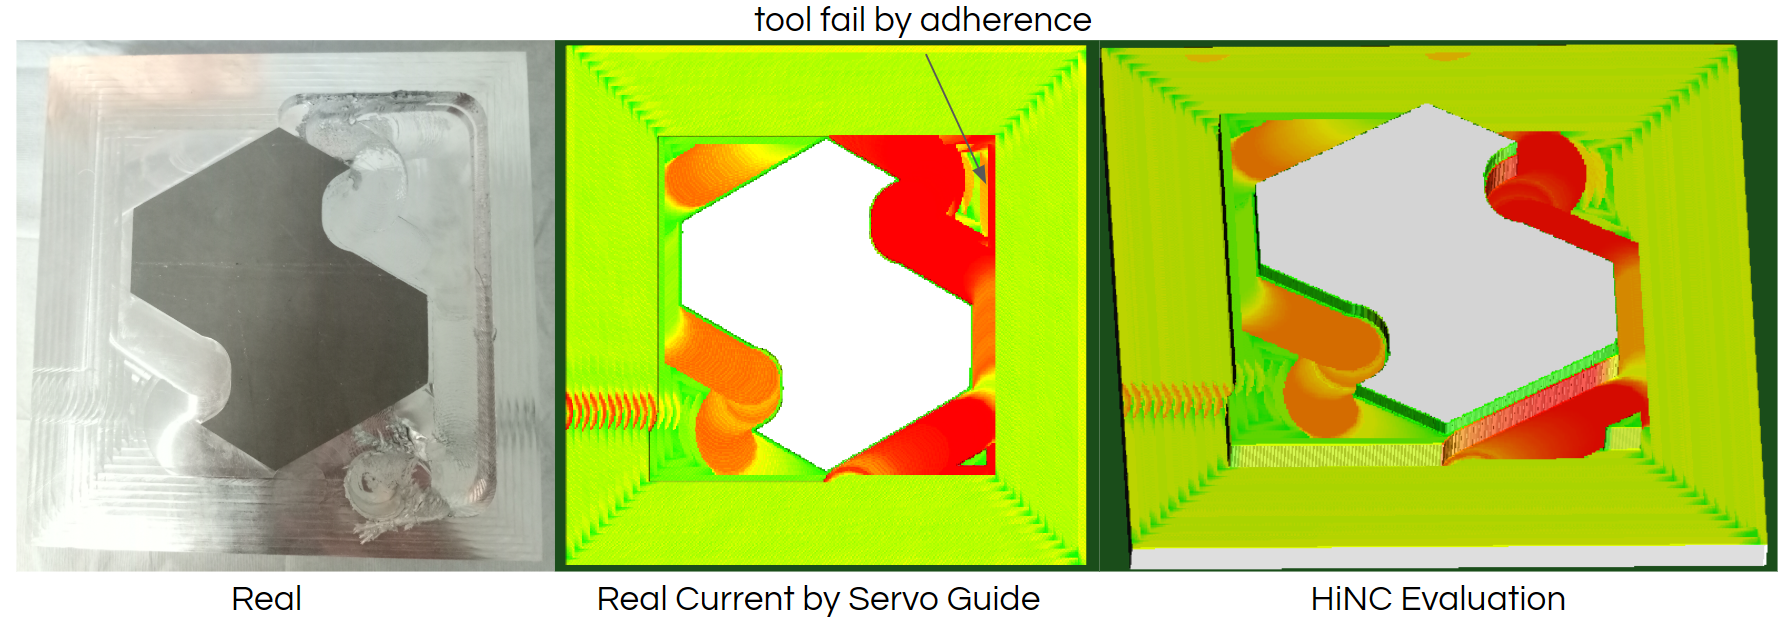
The same physics detects the failure before it happens. Torque overload — the spindle unable to supply the demanded load — is reported per step, alongside the marks it will leave.
A Worked Maximum Feed Rate
The minimum tool-breakage stress follows from the cutting parameters, and a maximum feed rate follows from that. For FDAC at HRC 41–44, a 6 mm four-flute cutter, a full slot at 3 mm depth, 6000 rpm and a safety factor of 2, the maximum feed rate works out at 880 mm/min.
The safety factor is doing real work in that number: it is where the condition of the specific machine enters — see Machine Condition and Safety Factors.
See Also
- Cutting Force Anomaly Cases — what forces tens of times the average look like in production
- Temperature and Wear — the quantities derived from the force validated here
- Evaluating Process Machinability — the ratios these forces are turned into
- Machine Condition and Safety Factors — the factor that turns the worked feed rate above into a value for a particular machine