A 17-Inch Forged Aluminium Wheel, Optimized: HiNC's Feed Optimization Takes 45 % off Both Set-ups, with the Finishing Passes Left at Their Programmed Feed
The 17-inch forged wheel is a one-piece 6061-T6 wheel an AI agent
designed from three public fitment numbers and programmed itself: two set-ups and six Fanuc G43.4
programs that HiNC wrote back from the agent's five-axis cutter locations and that replay exactly like
them. Together the programs run 17 min 25 s. Here the agent hands those accepted programs to HiNC's
feed optimization and asks what an engineer asks before using the result: how much time it saves,
what it does to the finishing passes, and whether any line comes out slower than programmed.
Three versions were optimized and replayed on the whole wheel at a 0.5 mm grid on HiNC 3.2.45. V1 optimizes every pass: 9 min 36 s, 44.9 % less, with the spindle at most 0.925 of its continuous rating; on the finishing flank it also bends the tool further, from 94.4 to 140.2 µm at the largest step. V2 keeps the final flank loops and the floor level of each back pocket at their programmed feed: 10 min 01 s, 42.5 % less, and those passes replay step for step as programmed, so protecting them costs 25.7 s, 5 % of the saving. V3 adds HiNC's source-feedrate floor at 100 %, so no step runs slower than programmed: 9 min 40 s, 44.5 % less, 99 % of V1's saving with the finishing untouched. The finishing passes are held at their programmed feed rather than capped by a target force, because on this five-axis flank HiNC's force target did not hold the force.
Most of the time saved comes from the feed-per-tooth ceilings the agent gave each tool, typical values for aluminium rather than a tool maker's data: on 86 % of the roughing tool's cutting steps and on nearly every step of the other tools, the ceiling, not the spindle, set the feed. Everything here is simulated; no wheel was cut.
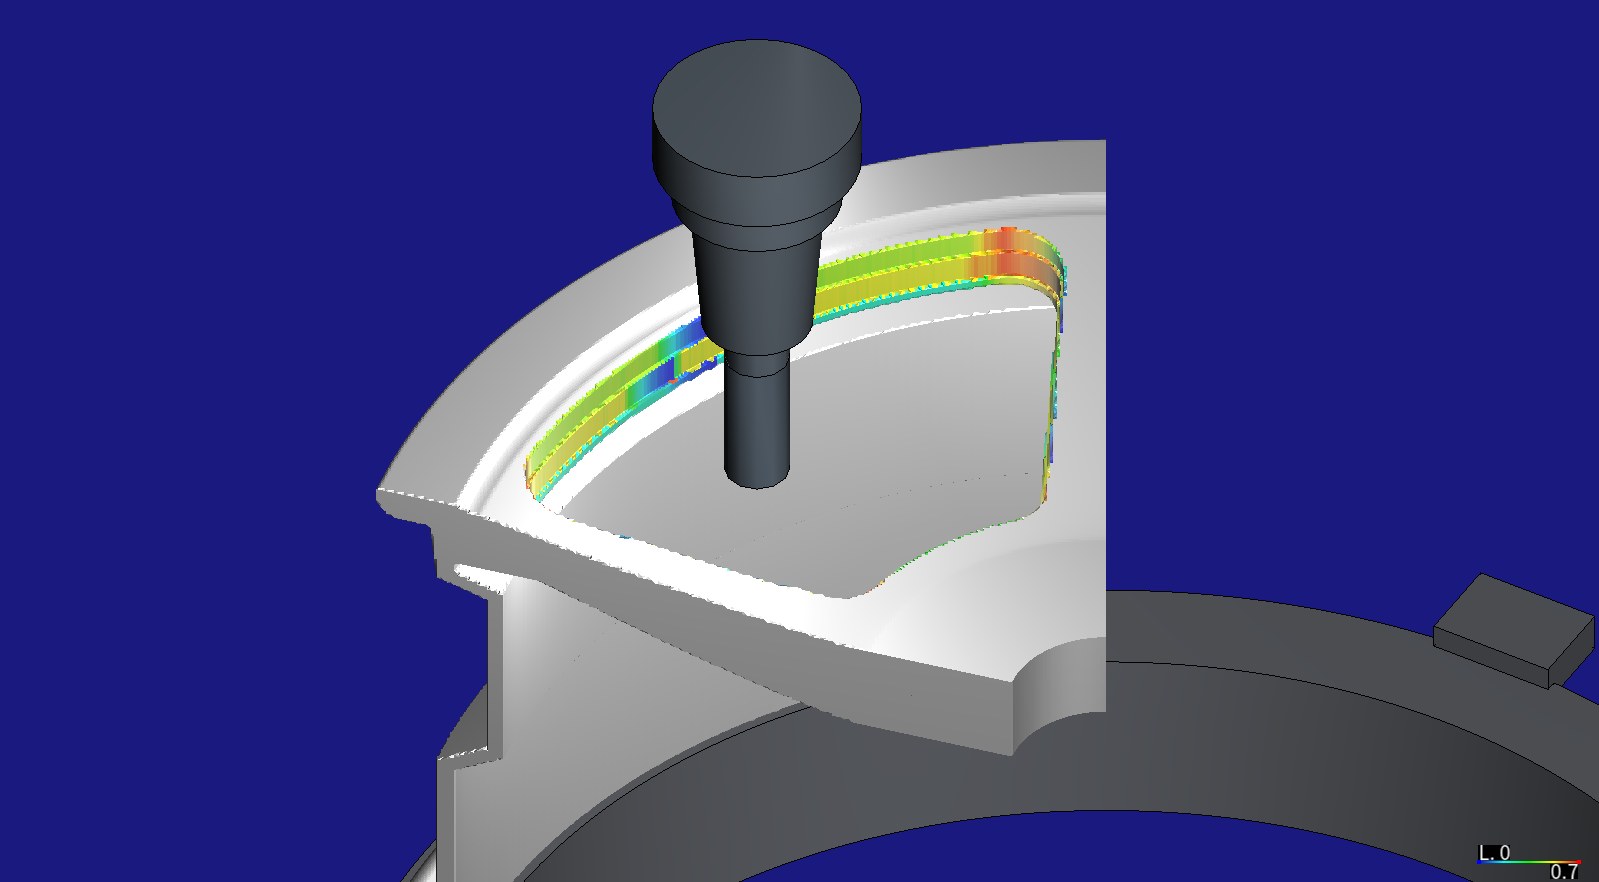
V1's optimized roughing program (T1, Ø20 mm end mill, 60 mm out of an 85 mm shrink-fit holder) after cutting window 0, the walls coloured by the spindle power ratio of the step that cut them, 0 to 0.7: yellow to red, up to the 0.667 target at the corner. HiNC 3.2.45, 0.5 mm grid; the program was played on the stock of the 72° sector, where window 0's cut is the same as on the whole wheel (dilemma 8).
| Measured on HiNC 3.2.45, whole wheel at 0.5 mm | Source program | V1, every pass optimized | V2, finishing at programmed feed | V3, V2 never slower than the source |
|---|---|---|---|---|
| Machining time, both set-ups | 17:25.1 | 9:35.5 (−44.9 %) | 10:01.1 (−42.5 %) | 9:39.7 (−44.5 %) |
| T1 roughing, spindle power against the short-term / continuous rating | 0.650 / 0.886 | 0.678 / 0.925 | 0.678 / 0.925 | 0.678 / 0.924 |
| Highest tool stress, share of yield | 0.367 (T5) | 0.333 | 0.333 | 0.367 (T5, held by the floor) |
| T2 final flank loops, XY tool-tip deflection, largest / 99th percentile | 94.4 / 62.4 µm | 140.2 / 70.1 µm | 94.4 / 62.4 µm | 94.4 / 62.4 µm |
| T6 pocket floor level, XY tool-tip deflection, largest / 99th percentile | 65.2 / 39.9 µm | 82.5 / 57.9 µm | 65.2 / 39.9 µm | 65.2 / 39.9 µm |
| Milled faces within ±0.3 mm of the design, OP30 / OP40 | 99.98 % / 100 % | 99.98 % / 100 % | 99.98 % / 100 % | 99.98 % / 100 % |
| Server time, optimization play and replay of both set-ups | — | 821 s | 826 s | 806 s |
| Peak memory, the OP30 optimization play | — | 24.1 GiB | 23.8 GiB | 22.8 GiB |
The case
The wheel's own case page tells how the agent designed the wheel, wrote its toolpaths and brought both set-ups through an acceptance; this page starts where that one ends. What the agent was given:
- Six accepted programs: the Fanuc programs HiNC wrote back from the agent's cutter locations, four for OP30 (face up: T1 roughs the five windows, T2 flanks their 7° drafted walls in five axes, T3 drills the stud holes, T4 cuts their 60° seats) and two for OP40 (turned over: T6 cuts the five back pockets from inside the barrel, T5 drills the valve hole at B 72.5°). They run 13 min 13.6 s and 4 min 11.5 s. The acceptance had found no collision, the spindle within its rating and the milled faces within −0.178 to +0.031 mm of the design.
- The machine, the spindle and the tools of that case: a generic table-C / swivel-head-B five-axis machine, a synthesized 15,000 rpm spindle rated 22 kW continuous and 30 kW short-term, and six generic tools in holders of real proportions.
- The request: showcases of HiNC's NC optimization built on existing cases, asked for by HiNC's product owner.
What nothing states:
- How fast these tools may go. The tools are generic, so no maker's feed-per-tooth limit exists. The ceiling each tool is given is the agent's choice, and it decides most of the result.
- Which passes are finishing. The programs carry no such mark. The agent knows from its own CAM: T2's second loop in each window is the final flank, and the last level of each back pocket finishes the floor and the walls to size.
- Whether the grid reads the finishing allowance: 0.4 mm on the flank and 0.3 mm in the pockets, under the 0.5 mm grid the optimization runs on.
What the agent built
Each value is marked read (from the programs or the case), derived (computed from them), chosen (the agent's choice) or default (HiNC's default, kept).
Three versions, each one optimization play and one replay per set-up. The optimization play plays the source programs with an NC optimization setting before each and writes the optimized files after; its per-step results are therefore the “before”. The replay plays the optimized programs on the same machine at the same grid; its per-step results are the “after”. Twelve whole-wheel plays in all.
| Version | What changes | What it answers |
|---|---|---|
| V1 | Every program optimized, the finishing passes included; the same settings as the wheel's case page | the time HiNC's optimization takes out with these ceilings |
| V2 | V1, with T2's five final flank loops and T6's five pocket floor levels held at their programmed feed | what protecting the finishing costs |
| V3 | V2, with the source-feedrate floor at 100 %: no step slower than programmed | how much of the gain survives a rule that the program may only get faster |
The NC optimization setting placed before every program:
| Setting | Value | Source |
|---|---|---|
| Feed optimization, re-interpolation | on | chosen |
| Forward, side and depth compensation | off | chosen: compensation is not part of this study |
| Spindle power and torque safety factors | 1.5: the target is 67 % of the short-term rating, 20 kW input, under the 22 kW continuous rating | default |
| Tool stress | the tool's own optimization limit, safety factor 3: the stress is held to a third of yield; the mission's own yield and thermal-yield factors 0, which do not switch the tool's off | default (tool), chosen (mission) |
| Target force | none (Infinity) |
default |
| Feed rate, lowest and highest | 300 and 20,000 mm/min | chosen: HiNC's default lowest, 1 mm/min, is not a cutting feed |
| Feed for stretches with no cutting | 20,000 mm/min | chosen |
| Acceleration of feed changes | 1,000 mm/s² | chosen: the default 10 mm/s² would spread every change over hundreds of millimetres |
| Extended distance before and after a cut | 2 mm and 2 mm | default |
| Feed-rate assignment ratio | 0.01 | default |
| Source-feedrate floor | off in V1 and V2; on at 100 % in V3 | default (off), chosen (V3) |
| Maximum feed per tooth | per tool, below | chosen |
| Grid | 0.5 mm for the machining and the stock | chosen: the grid of the optimization on the wheel's case page, so the two compare directly (dilemma 3) |
Each tool's own optimization limit was sent before every play through PUT api/Cutter/{id}/opt-limit
and read back into the run record: optimization on, yield safety factor 3, the minimum-chip-thickness
and relief-angle limits on, no minimum feed per tooth, and the ceiling below. The ceilings are typical
values for carbide end mills and drills in aluminium, not a maker's data for these tools; each is set
beside the feed per tooth the program already commands:
| Tool | Programmed feed per tooth (F ÷ rpm ÷ flutes) — derived | Ceiling — chosen | Ceiling ÷ programmed |
|---|---|---|---|
| T1 Ø20 end mill, 3 flutes, 12,000 rpm | 0.119 mm (F4300); 0.072 mm where it cuts wide (F2600); 0.056 mm on the helical entries | 0.18 mm | 1.5 |
| T2 Ø12 end mill, 3 flutes, 15,000 rpm | 0.080 mm (F3600); 0.022 mm on the lead-in and lead-out | 0.10 mm | 1.25 |
| T3 Ø15 drill, 2 flutes, 6,000 rpm | 0.125 mm (F1500) | 0.15 mm | 1.2 |
| T4 Ø25 60° countersink, 2 flutes, 4,000 rpm | 0.050 mm on the seat (F400); 0.150 mm through the hole (F1200) | 0.05 mm | 1.0 |
| T6 Ø12 end mill, 3 flutes, 14,000 rpm | 0.060 mm (F2520); 0.029 mm on the ramps (F1200) | 0.10 mm | 1.67 |
| T5 Ø11.3 drill, 2 flutes, 7,000 rpm | 0.100 mm (F1400); 0.200 mm feeding back out of the wall (F2800) | 0.14 mm | 1.4 |
T4's ceiling equals the seat's programmed value, so the optimizer can only bring T4 back to it, never past it.
The finishing passes held in V2 and V3 — read from the agent's CAM. In a copy of each program,
T2's second loop in each of the five windows (936 lines each, from its first G01 to the retract) and
the level of each of the five back pockets that reaches the floor (124 to 128 lines each, from the
ramp's first G01 to the retract) are wrapped in (@@BeginPreserve();) … (@@^EndPreserve();); the
agent's script checked that every other line of the copy is the source's. The motion is unchanged, so
the “before” of V2 and V3 is the same play as V1's.
Not changed by the optimizer: rapid moves, tool changes and the G43.4 / G49 lines. The
wheel has no drilling cycle: the drills are written as G01 moves, so they are optimized like any
other cut.
How the agent managed the work
- Criteria and settings first. Nine criteria and every setting with its source were written down before the first optimization play, the trials included. What the trials changed was written beside the plan before V2's first play, the original left as written.
- Trimmed first. The 72° sector of the wheel — one window, its stud hole, the valve and half of two back pockets — went through the whole chain at 1 mm (optimize, replay, check that the optimizer really changed the feed and that an embedded target reached the finishing passes), then at 0.5 and 0.25 mm to see whether the grid reads the finishing allowance. Fifteen trial plays, 20 to 230 s and 1.7 to 17.8 GiB each.
- One whole-wheel run per version. A private copy of HiNC 3.2.45 on a 32-thread server shared with live instances and other agents' studies. Before every heavy play the instance was restarted and the project reloaded from its file, so no setting from an earlier play could carry over; the plays queued on a lock shared with the other studies and started only with 40 GB of the server's memory free, and a read-only check every three minutes looked at the alarms, the line the play had reached, contact and loads. It raised no alert.
- Settings read back. The optimization setting and each tool's limit were read back from the instance after every play and kept with the results, beside the messages, the server time and the memory.
- Where a person stepped in. HiNC's product owner asked for NC-optimization showcases built on existing cases; the versions, the settings and the criteria are the agent's.
The criteria as written before the first optimization play, with the cutting steps defined as the steps in contact that remove more than 0.01 mm³/s:
| # | Criterion |
|---|---|
| O1 | Every optimized program replays to its end with no new alarm: no Collided, no Play-RapidCut--Detected, no stroke alarm, no error in any message sink; every warning of a replay already seen in the optimization play; every optimization play ends with as many files optimized as it has programs |
| O2 | On the replay, for every tool, at least 99 % of the cutting steps within the targets: short-term power and torque ratios ≤ 0.667, stress ratio ≤ 0.333; and every step: power and torque ratios ≤ 1, stress ratio < 1, continuous power ratio ≤ 1.05. Steps V3's floor holds above a target are counted apart |
| O3 | The shape does not change: the part HiNC exports at 0.5 mm has at least 99 % of the milled faces within ±0.3 mm of the design, and their 1st and 99th percentiles each within 0.05 mm of the source program's at the same grid |
| O4 | Time, predicted: V1 −45 % ± 3 points; V2 slower than V1 by at most 40 s; V3 no slower than V2 and at most 10 s faster; the times recorded as measured |
| O5 | The finishing passes in V2 and V3: largest XY tool-tip deflection on their cutting steps ≤ the source's largest × 1.02, 99th percentile ≤ the source's × 1.02; V1 recorded only; all three set beside the 0.2 mm tolerance |
| O6 | The feed for cutting in air never lands on stock: no replay step commanded at 20,000 mm/min or more is in contact; each tool's contact steps within 1 % of the source's; the optimizer log's untouched rows match the source's untouched steps; a sector program optimized at 0.5 mm and replayed at 0.25 mm has no air-feed step in contact either |
| O7 | The output files really are rewritten, cleanly: each optimized file differs from its source; no error in the program manipulation messages; line counts and feed ranges recorded |
| O9 | What set the feed: each tool's cutting steps classified by the limit that set them; predicted T1 about 86 % at the ceiling and 14 % on spindle power, T2 and T6 almost all at the ceiling |
A ninth criterion in the plan, O8, predicted a reading of HiNC's tool-deflection model itself rather than anything the optimization does, and is not repeated here.
The dilemmas
Each is told as its situation, the risk had it been missed, how it was noticed, the resolution, and the evidence that the resolution held.
1. The force target did not hold on the five-axis flank
- Situation. The plan first held the finishing passes with a target force embedded in the program:
a
(@@OptPreferedForce_N=…;)comment on the first line of each finishing block, released again at its retract, so the optimizer would cap the force, and with it the deflection, only there. - Risk. Had it been used as planned, V2 would have looked like a protected finishing pass while the finishing ran at the ceiling, as in V1.
- How noticed. On the 72° sector at 1 mm, the embedded target reached exactly the finishing steps (2,660 of T2's and 1,954 of T6's carried it). The agent's check script then compared, for every step already above the target before optimization, the feed per tooth the force criterion allowed in the optimizer's per-step log with what would bring that step down to the target.
- What it showed. On T2's five-axis flank, all 228 steps above a 343 N target were allowed the full 0.10 mm ceiling (the largest force 552 N); set for the whole program at 300 N, all 3,414 steps above it were allowed the ceiling too, and the optimized flank program came out the same as V1's apart from comments. On the three-axis tools the target held in part: at 700 N on the roughing, 768 of the 7,656 steps above it still reached the 0.18 mm ceiling; at 354 N on the pocket floor level, 2 of the 38 steps above it reached the ceiling, and the sector's replay peaked at 399 N on that level, against 667 N in the source program and 891 N with every pass optimized.
- Resolution. Written beside the plan before V2's first play: the finishing passes are held at their
programmed feed with
BeginPreserve()…EndPreserve(), the fallback the plan had named. - Evidence. V2's and V3's finishing passes replay step for step as the source: the same 13,298 cutting steps on T2's final loops, the largest deflection 94.4 µm and the 99th percentile 62.4 µm, as before the optimization (criterion O5).
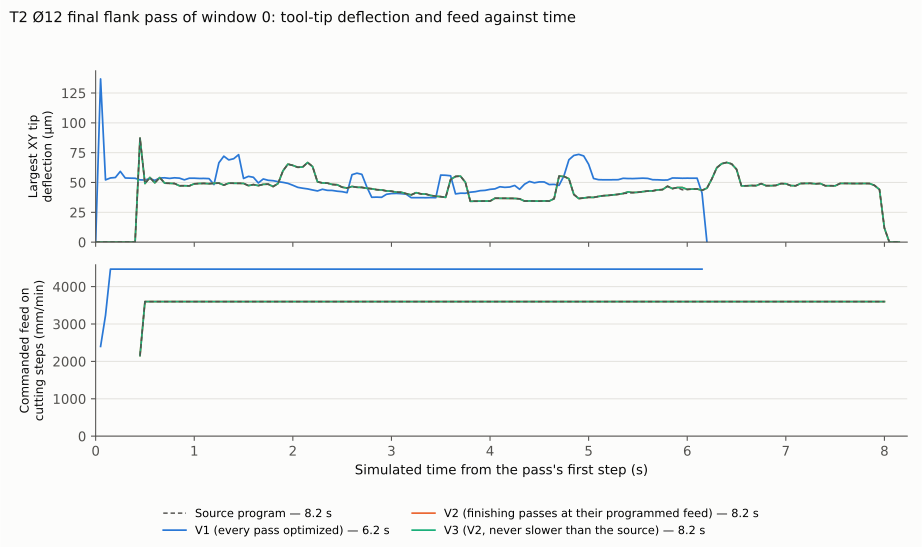
T2's final flank loop in window 0. V1 takes the loop from 3,600 to its 4,500 mm/min ceiling: 6.2 s instead of 8.2 s, with more deflection all along and the most at the entry. V2 and V3 lie on the source's curve.
2. A cap rule that would have held one step
- Situation. The plan derived the target force from the finishing steps' own compliance: the allowed deflection was the largest XY tip deflection of the pass before optimization; every step predicted to bend more than that at the ceiling gave a cap, the allowance divided by the step's compliance, and the target was the smallest of those caps.
- Risk. The largest deflection sat on the entry step of the finishing loop, at 0.022 mm per tooth, so the allowance was high and the rule bound one step. Typical finishing steps would have bent about 25 % more, the 99th percentile from 73 to 92 µm by a linear prediction, against criterion O5.
- How noticed. The agent's exploration script on the trial data.
- Resolution. Replaced, together with dilemma 1, by holding the passes at their programmed feed. The targets the rule gives on the whole wheel, 499 N for T2 and 562 N for T6, are recorded and were never used.
- Evidence. O5 is met on the 99th percentile as well as on the largest step.
3. A grid coarser than the finishing allowance
- Situation. The study runs at 0.5 mm, the grid of the optimization on the wheel's case page; on the sector, a 0.25 mm optimization play took 230 s and 17.8 GiB against 80 s and 6.5 GiB at 0.5 mm. The finishing allowance is 0.4 mm on the flank and 0.3 mm in the pockets.
- Risk. A grid can read a real cut as air. The optimizer would then write that stretch at the 20,000 mm/min it is given for cutting in air, and the replay would drive the tool into the stock at it.
- How noticed. Written into the plan as a risk before the first play.
- Resolution. The sector at both grids: T2's contact steps 5,306 at 0.5 mm and 5,306 at 0.25 mm; T6's 15,241 and 15,706, 3 % fewer at 0.5 mm; the finishing deflection, 99th percentile and largest, 62.3 / 87.2 µm and 59.3 / 87.3 µm on T2, 38.5 / 46.6 µm and 36.8 / 44.8 µm on T6. The sector programs optimized at 0.5 mm were replayed at 0.25 mm: no step at the air feed touched the stock for T1, T2, T3, T4 or T6.
- Evidence. On the whole wheel no step at the air feed removed anything (criterion O6, dilemma 6).
4. Most of the pocket tool's cutting was ramping
- Situation. Of the source program's 188.9 s of T6 cutting, 136.5 s ran at 0.029 mm per tooth: the F1200 of the 3° helical ramp into each level, 4 mm deep and 128 lines long on most levels, as the agent's own CAM wrote it. The optimizer took these steps to the 0.10 mm ceiling, 4,200 mm/min. That is most of T6's −54 % in V1.
- Risk. A ramp in a closed pocket is where the chips have the hardest way out, and the model does not see chip evacuation. Read as a plain gain, the 54 % overstates what a shop would accept.
- How noticed. The time-weighted feed-per-tooth histogram of each tool.
- Resolution. Reported as it is, with the advice a shop would follow: give the ramps a ceiling of their own, or hold them at their programmed feed like the finishing passes. The ramp into each floor level is already held in V2 and V3, as part of the finishing block.
- Evidence. The histogram below: T6's source time sits at 0.029 mm (ramps) and 0.060 mm (levels); V1's at the 0.10 mm ceiling.
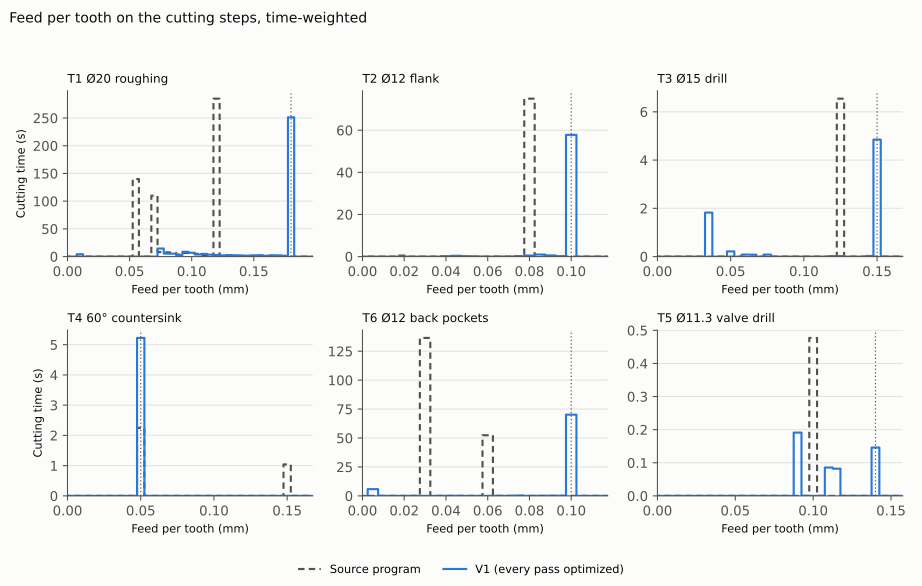
Feed per tooth on the cutting steps, weighted by time, the source program and V1. The dotted line is each tool's ceiling. T1's source time is spread over 0.056, 0.072 and 0.119 mm; V1 puts almost all of it at 0.18 mm. T3's bar at 0.033 mm is the relief-angle limit at the drill's entry.
5. The never-slower floor saved twice what was predicted
- Situation. Criterion O4 predicted V3 no slower than V2 and at most 10 s faster. V3 came in 21.5 s faster.
- Risk. Read without the breakdown, the floor looks like a setting that can only cost time, or the miss like noise.
- How noticed. The per-program times of V2 and V3.
- Resolution. The verdict stays as written: O4 is not met for V3. The breakdown: the floor removed the drill's slow-down at its entry (T3, −2.3 s) and T4's through-hole moves pulled down to the seat's ceiling (−2.8 s), and it stopped the smoothing from dragging the feed transitions of T1 and T6 below their programmed feed (−9.0 s and −7.3 s). It also kept the lines of each level's first contact step off the 300 mm/min minimum (results, below).
- Evidence. The chart below: V3 is the fastest of the three on T1, T3 and T4.
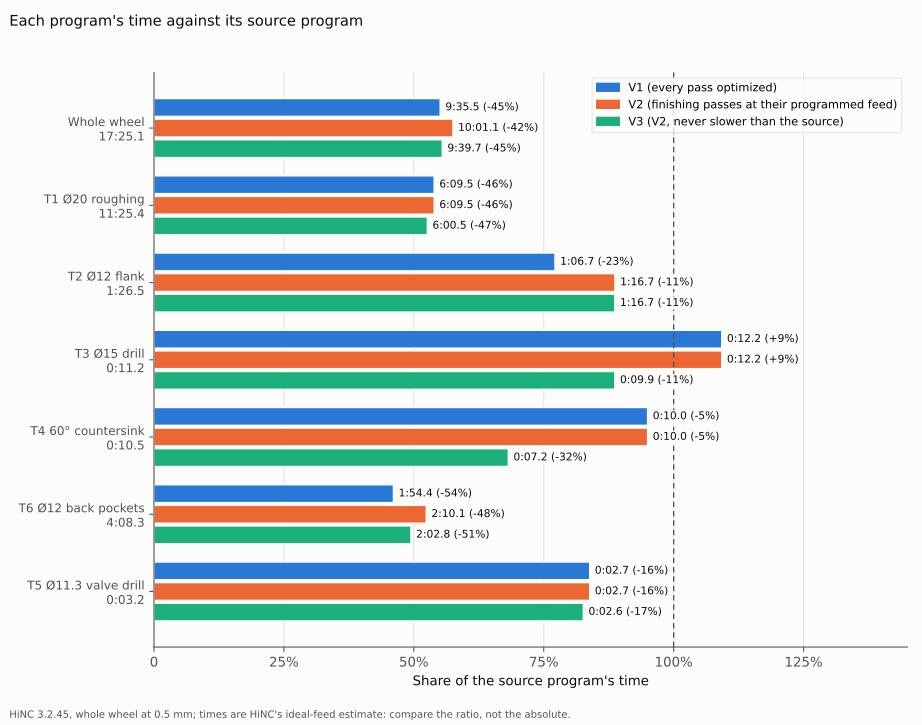
Each program's time against its source. Only V1 and V2 make a program slower than the source, the Ø15 drill by 9 %; V3, which may only speed lines up, is 11 % faster there.
6. A criterion that counted the wrong thing
- Situation. Criterion O6 asked that each tool's contact steps stay within 1 % of the source's. A step is one spindle revolution, so a faster program has fewer of them: T1's 129,623 became 84,307. Its first clause did not hold to the letter either: in each replay, one step of the valve drill's exit line, run at the air feed, read contact with nothing removed and no force.
- Risk. As written, the criterion flags a faster program as one that lost its cutting.
- Resolution. Judged as written, not met, and its intent checked another way: each program's removed volume, the removal rate times the step time summed over the steps, came within −1.5 % to +1.1 % of the source's; no step at the air feed removed anything; and the optimizer log's untouched rows plus the rapid steps equal the source's untouched steps in all six programs.
- Evidence. The removed-volume table in the results.
7. One lock for five plays
- Situation. Each heavy play queued on a lock shared with other agents' studies; one waited 986 s behind another study's play.
- Risk. Queued one by one, the remaining five plays would have taken one to two hours.
- Resolution. The five ran in a chain under one hold of the lock, about 16 minutes.
- Evidence. The queue times kept with every play's record.
8. Before and after from the same view
- Situation. The pictures had to show the same place from the same camera before and after, with the holder in view and the tool standing at the same point in both, without a whole-wheel play for each picture.
- Resolution. The whole wheel's T1 program, source and V1's, played on the stock of the 72° sector — window 0's cut is the same as on the whole wheel — each followed by the same short program that moves the tool only in air to its picture pose.
- Evidence. The pictures here and at the top of the page: the same camera, the walls coloured by the step that cut them. The two picture plays took 125 s and 95 s.
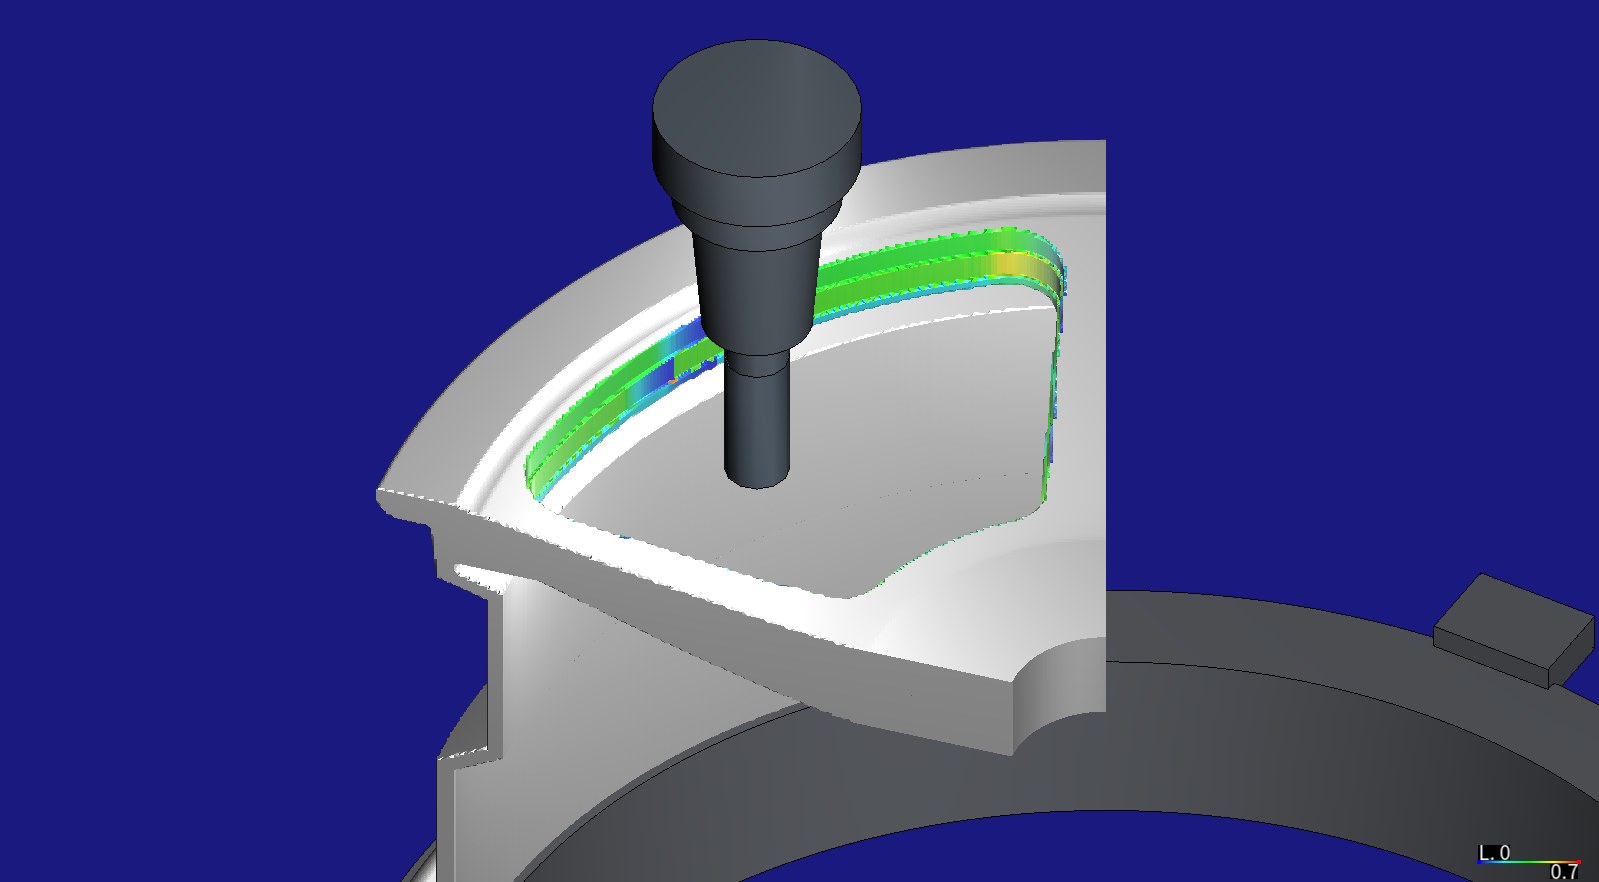
Before: the source program in window 0, coloured by spindle power ratio, 0 to 0.7. The walls are mostly green, about 0.45; compare the picture at the top of the page, after V1.
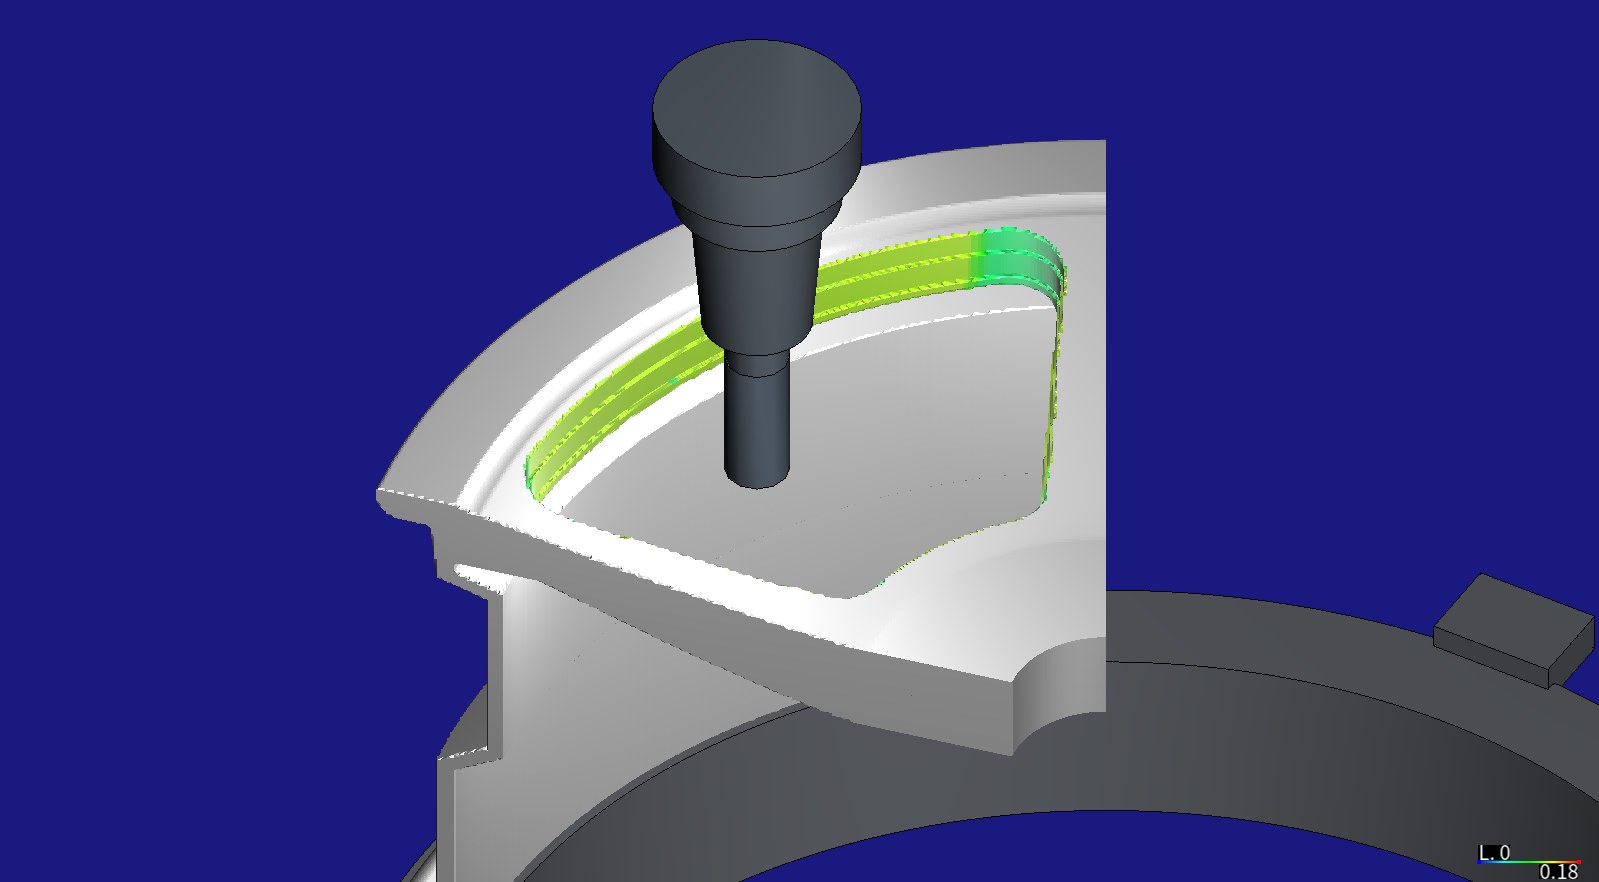
Before, coloured by feed per tooth, 0 to 0.18 mm: the program's 0.119 mm, and 0.072 mm where it cuts wide.
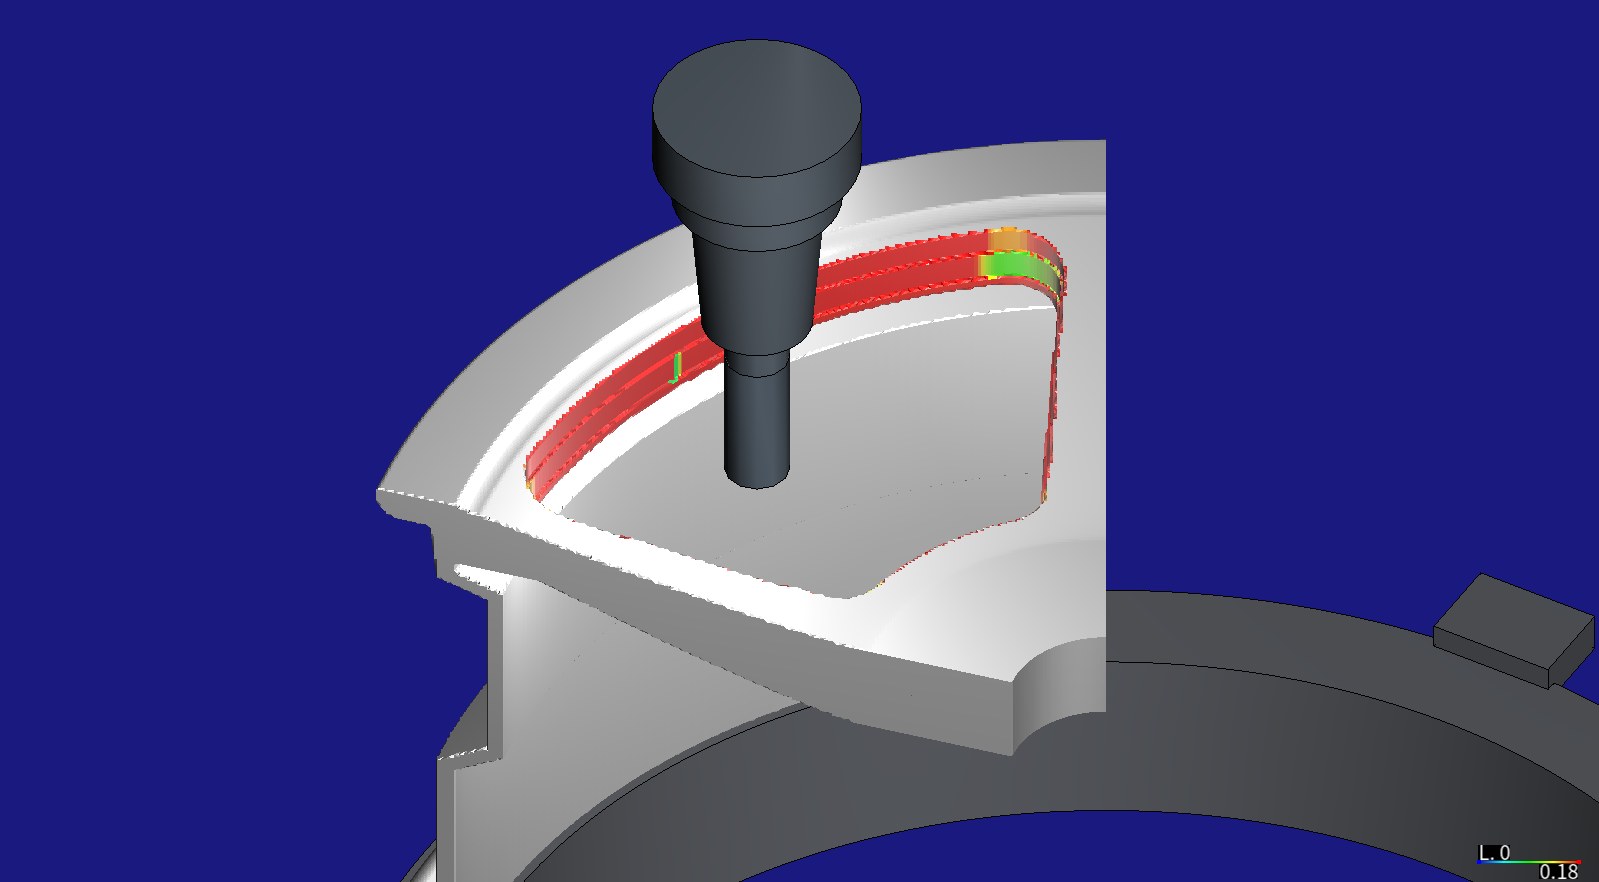
After V1, the same colouring: almost every step at the 0.18 mm ceiling, lower only at the corner where the spindle power target holds the feed.
Results and benefits
Measured on HiNC 3.2.45 on the whole wheel at 0.5 mm. The criteria are the ones written before the first optimization play.
| # | Verdict | Measured |
|---|---|---|
| O1 | met | All twelve plays ran to the end. The six replays: no Collided, no Play-RapidCut--Detected, no stroke alarm, no warning or error in the four message sinks. Each optimization play wrote as many files as it had programs. The one warning of the twelve plays was V3's OP40 optimization play: NcOpt-Feed--SourceFloorOverTarget, one step (yield), the floor's expected report |
| O2 | met | Cutting steps above a target: T1 0.066 % in V1 and V2, 0.26 % in V3, every other tool 0 %; no step with a power or torque ratio above 1 or a stress ratio of 1 or more; the continuous power ratio at most 0.925. Counted apart: V3's valve drill, 2 of 57 steps at 0.367 of yield, the source program's own value held up by the floor |
| O3 | met | Milled faces within ±0.3 mm: OP30 99.98 % in every version, the same five points below −0.3 mm as the source (lowest −0.366 mm, on edges the 0.5 mm grid rounds); OP40 100 %. The 1st and 99th percentiles within 0.0003 mm of the source's |
| O4 | V1 met, V2 met, V3 not met | V1 −44.9 % (predicted −45 ± 3); V2 25.7 s slower than V1 (predicted at most 40 s); V3 21.5 s faster than V2 (predicted at most 10 s; dilemma 5) |
| O5 | met (V2, V3) | T2's final loops, largest / 99th percentile XY tip deflection: source 94.4 / 62.4 µm, V1 140.2 / 70.1 µm, V2 and V3 94.4 / 62.4 µm; T6's floor level: 65.2 / 39.9 µm, V1 82.5 / 57.9 µm, V2 and V3 65.2 / 39.9 µm. All under the 0.2 mm tolerance |
| O6 | not met as written, met in intent | Dilemma 6 |
| O7 | met | All 18 optimized files differ from their sources; no program manipulation message; line counts and feed ranges below |
| O9 | met | As predicted; the table below |
The time, program by program (simulated seconds, without tool changes or loading; the totals are the plays' own end times, so the rounded programs of V2 add up to 0.1 s more than its total):
| Program | Source | V1 | V2 | V3 |
|---|---|---|---|---|
| T1 Ø20 roughing | 685.4 | 369.5 (−46 %) | 369.5 (−46 %) | 360.5 (−47 %) |
| T2 Ø12 flank | 86.5 | 66.7 (−23 %) | 76.7 (−11 %) | 76.7 (−11 %) |
| T3 Ø15 drill | 11.2 | 12.2 (+9 %) | 12.2 (+9 %) | 9.9 (−11 %) |
| T4 60° countersink | 10.5 | 10.0 (−5 %) | 10.0 (−5 %) | 7.2 (−32 %) |
| T6 Ø12 back pockets | 248.3 | 114.4 (−54 %) | 130.1 (−48 %) | 122.8 (−51 %) |
| T5 Ø11.3 valve drill | 3.2 | 2.7 (−16 %) | 2.7 (−16 %) | 2.6 (−17 %) |
| Both set-ups | 17:25.1 | 9:35.5 (−44.9 %) | 10:01.1 (−42.5 %) | 9:39.7 (−44.5 %) |
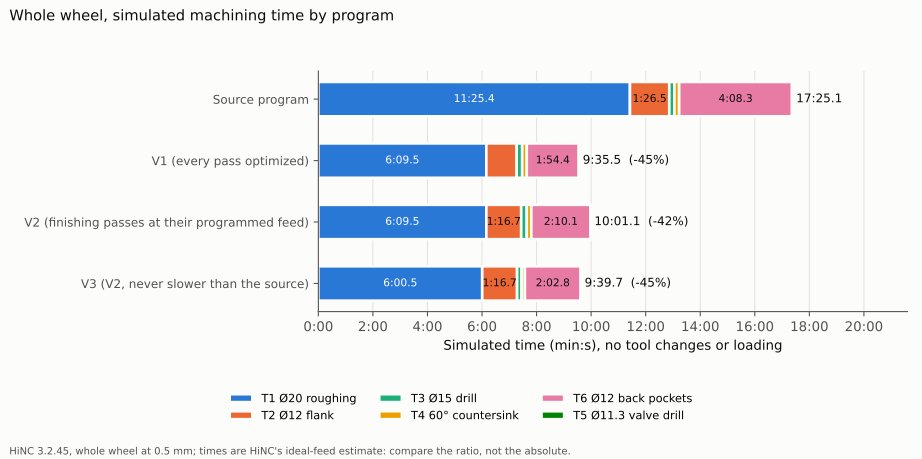
The whole wheel by program. T1's roughing is two thirds of the source program's time and most of the saving.
Where V1's time went. Of the 469.6 s V1 saves, the steps that touch the part give most and the moves in air the rest; the optimizer runs a stretch with no cutting at the 20,000 mm/min it is given for cutting in air:
| Tool | Steps touching the part | Steps in air |
|---|---|---|
| T1 | −244.2 s | −71.8 s |
| T6 | −112.1 s | −21.8 s |
| T2 | −14.5 s | −5.2 s |
| T3 | +0.6 s | +0.4 s |
| T4 | +1.9 s | −2.5 s |
| T5 | 0.0 s | −0.6 s |
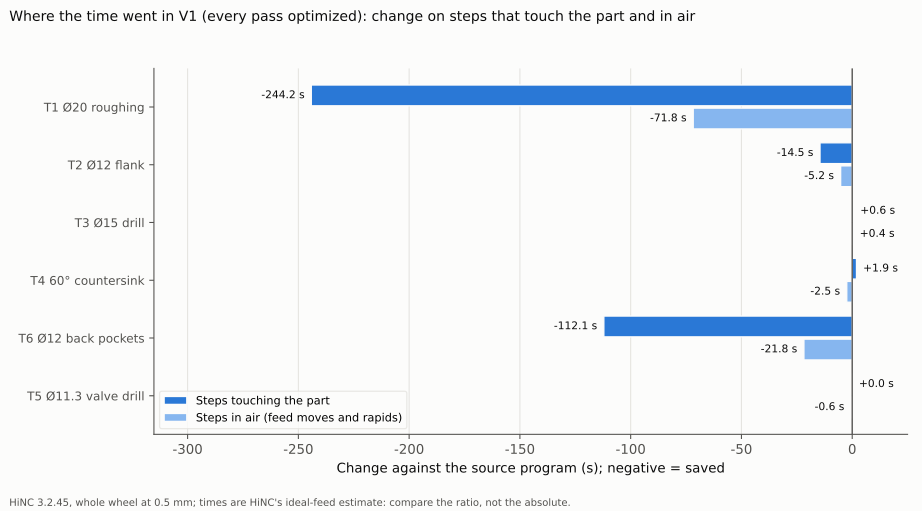
V1 against the source, per program. Three places go the other way: the Ø15 drill's entry, where the relief-angle limit holds the feed per tooth to 0.033 mm (391 mm/min) while the point enters; the countersink's moves through the hole at F1200 that already touch its edge, brought down to the 0.05 mm ceiling, 400 mm/min; and the first contact step of each new level, written at the 300 mm/min minimum.
What the loads did. V1, each program's peaks before and after on its cutting steps:
| Program | Spindle power, short-term | Continuous, after | Torque, after | Stress, of yield | Largest force | XY tip deflection, 99th pct / largest | Steps at the ceiling |
|---|---|---|---|---|---|---|---|
| T1 Ø20 roughing | 0.650 → 0.678 | 0.925 | 0.378 | 0.150 → 0.207 | 919 → 1,253 N | 47.9 / 53.6 → 66.6 / 74.1 µm | 86.4 % |
| T2 Ø12 flank | 0.278 → 0.375 | 0.512 | 0.186 | 0.251 → 0.333 | 551 → 715 N | 81.8 / 101.4 → 94.6 / 140.2 µm | 99.7 % |
| T3 Ø15 drill | 0.305 → 0.362 | 0.493 | 0.145 | 0.033 → 0.039 | 456 → 530 N | 0.0 / 4.5 → 1.0 / 2.8 µm | 94.5 % |
| T4 60° countersink | 0.172 → 0.172 | 0.234 | 0.050 | 0.009 → 0.009 | 118 → 59 N | 0.39 / 0.39 → 0.22 / 0.22 µm | 100 % |
| T6 Ø12 back pockets | 0.433 → 0.541 | 0.738 | 0.236 | 0.264 → 0.333 | 820 → 1,013 N | 34.3 / 65.2 → 49.6 / 82.5 µm | 99.85 % |
| T5 Ø11.3 valve drill | 0.164 → 0.224 | 0.306 | 0.083 | 0.367 → 0.332 | 498 → 451 N | 104.6 / 111.6 → 107.8 / 108.4 µm | 76.8 % |
The deflection is the reading of HiNC's tool-beam model, not a measurement. With no target force set, the optimizer held power, torque and stress, not force: where it sped up cuts that used little power, the largest force rose, by a third on T1. In V2 and V3 the peaks of T6 stay at the source's (0.433 and 820 N), because its heaviest steps are in the held floor level.
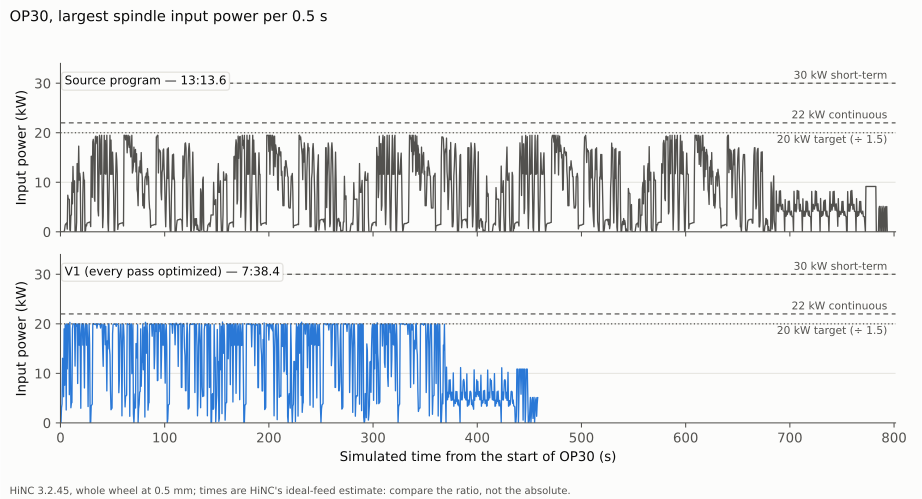
All of OP30, the largest spindle input power per 0.5 s. V1 flattens the roughing onto the 20 kW target, the spindle's input power at 67 % of its short-term rating, and the set-up ends at 7:38.4 instead of 13:13.6.
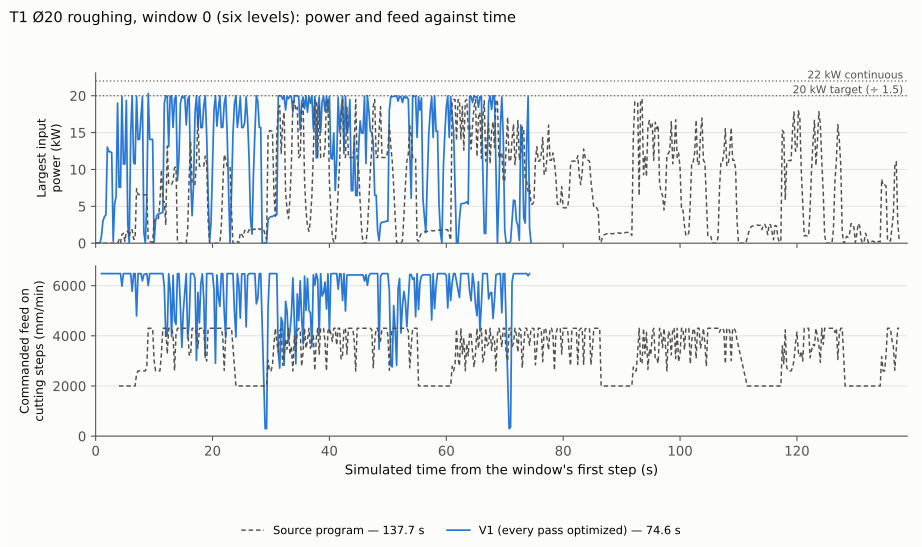
T1 in window 0: V1 runs the 0.18 mm ceiling, 6,480 mm/min, wherever the spindle allows, and slows where its power reaches the 20 kW target: 74.6 s instead of 137.7 s. The two dips to 300 mm/min are the first contact steps of new levels.
What set the feed. The optimizer writes, for every step, the feed per tooth each limit allows; the lowest is the step's. These plays kept the smoothing on, which carries neighbouring steps into what the log records, so the shares below are the limits as the log records them, not each step tested on its own with the smoothing off. V1's cutting steps by the limit that set them:
| Tool | Cutting steps | Feed-per-tooth ceiling | Spindle power | Tool stress | Relief angle | Other |
|---|---|---|---|---|---|---|
| T1 | 129,608 | 86.4 % | 13.6 % | — | — | minimum feed 0.07 % |
| T2 | 26,525 | 99.7 % | — | 0.3 % | — | — |
| T3 | 655 | 94.5 % | — | — | 5.5 % | — |
| T4 | 225 | 100 % | — | — | — | — |
| T6 | 45,520 | 99.85 % | 1 step | 1 step | — | minimum feed 0.12 %, spindle torque 13 steps |
| T5 | 56 | 76.8 % | — | 21.4 % | 1.8 % | — |
In V3 the floor sets T4's 225 steps, 20 of T1's, 12 of T6's and 1 of T5's, and no line is written at the 300 mm/min minimum.
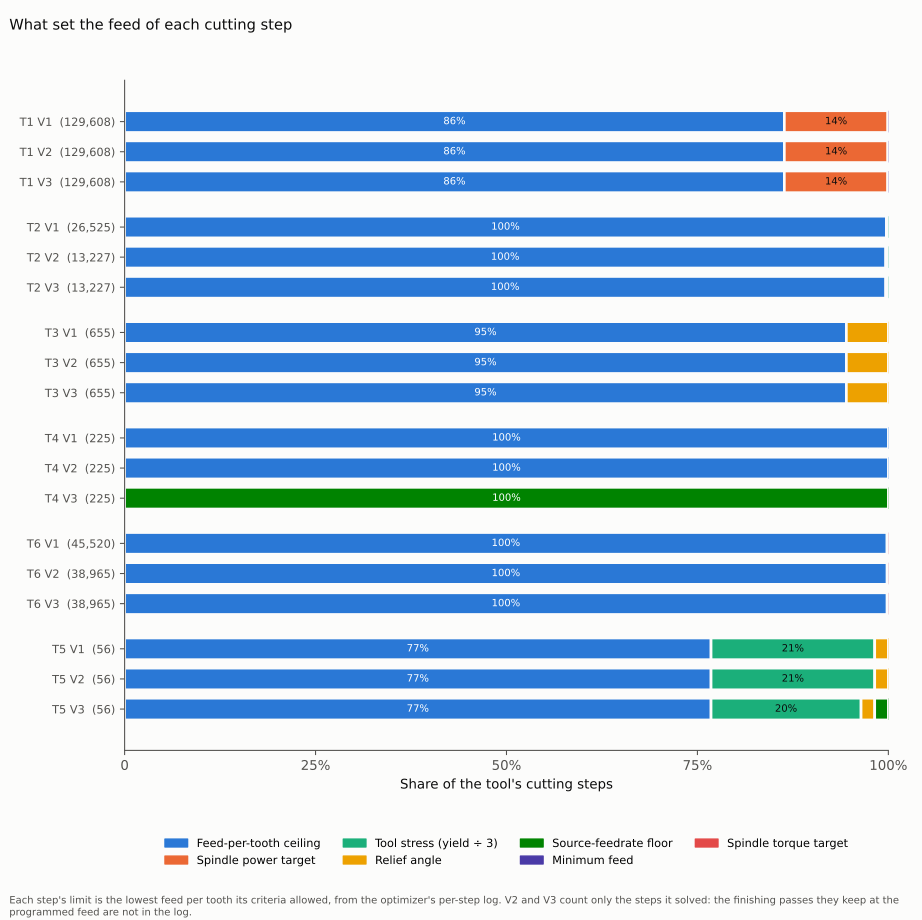
The limit that set each cutting step's feed, from the optimizer's per-step log. V2 and V3 count only the steps the optimizer solved: the finishing passes they hold are not in the log.
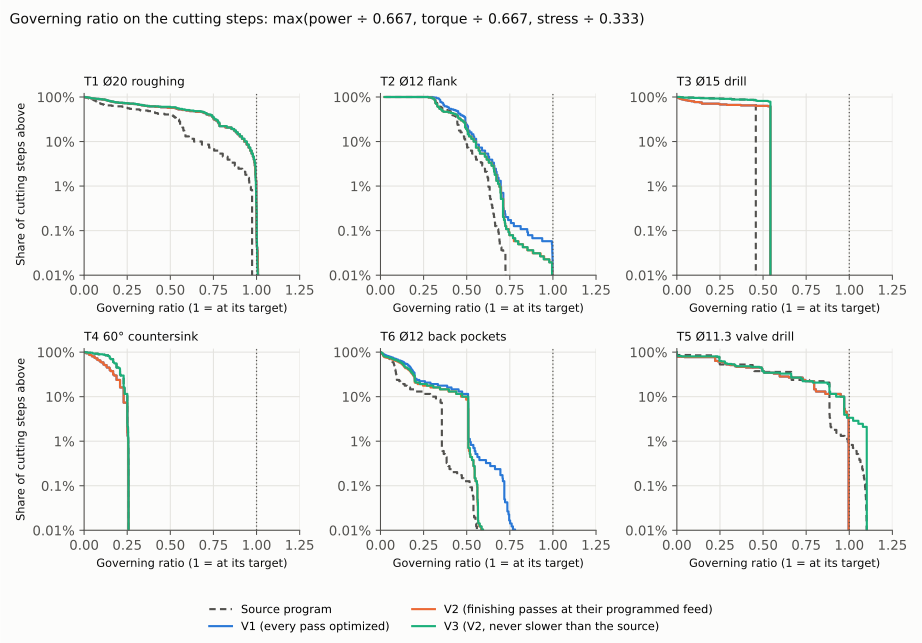
How close each step comes to its target. T1 is the only tool the spindle holds; tool stress holds a fifth of T5's steps and a few of T2's at 1; the rest stop at their ceiling well below 1. T5 reaches 1.10 in the source program and in V3, where the floor keeps two steps at their programmed feed and 0.367 of yield.
The finishing passes. On their cutting steps, the XY tool-tip deflection and the force:
| Finishing pass | Cutting steps, source | Source | V1 | V2 | V3 |
|---|---|---|---|---|---|
| T2 final flank loops, largest / 99th percentile deflection | 13,298 | 94.4 / 62.4 µm | 140.2 / 70.1 µm | 94.4 / 62.4 µm | 94.4 / 62.4 µm |
| T2 final flank loops, largest force | 512 N | 715 N | 512 N | 512 N | |
| T6 pocket floor level, largest / 99th percentile deflection | 6,555 | 65.2 / 39.9 µm | 82.5 / 57.9 µm | 65.2 / 39.9 µm | 65.2 / 39.9 µm |
| T6 pocket floor level, largest force | 820 N | 1,013 N | 820 N | 820 N |
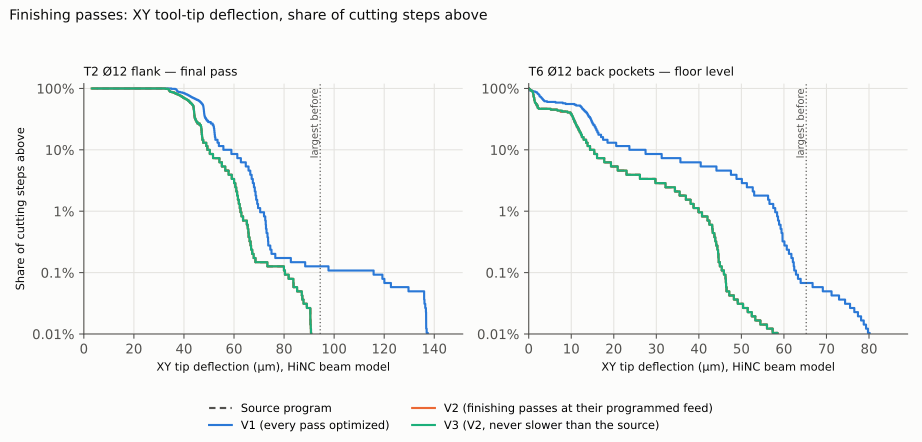
The finishing passes' deflection, share of cutting steps above a value. The dotted line is the source program's largest step; V1 passes it on both tools, V2 and V3 lie on the source's curve.
The shape. The part HiNC exports after each set-up against the design, at 0.5 mm:
| Part, milled faces | Points | Lowest | Highest | 1st percentile | 99th percentile | Within ±0.3 mm |
|---|---|---|---|---|---|---|
| OP30, source program | 24,643 | −0.3657 mm | +0.0061 mm | −0.0607 mm | +0.0032 mm | 99.98 % |
| OP30, V1 replay | 24,643 | −0.3657 mm | +0.0073 mm | −0.0608 mm | +0.0035 mm | 99.98 % |
| OP30, V2 and V3 replays | 24,643 | −0.3657 mm | +0.0061 mm | −0.0607 mm | +0.0032 mm | 99.98 % |
| OP40, source and every replay | 29,515 | −0.2684 mm | +0.0099 mm | −0.0186 mm | +0.0065 mm | 100 % |
The turned faces read the same in every version: OP30 10 of 275,357 points below −0.3 mm (lowest −0.392 mm) and 2 above +0.3 mm, OP40 1 of 270,485 below and 2 above; at 0.5 mm the grid's picture of the turned blank, which the wheel's acceptance at 0.25 mm reads within ±0.3 mm but for one point per set-up.
What was removed. Criterion O6's intent, program by program; removed volume is the removal rate times the step time, summed:
| Program | Source | V1 | V2 | V3 | Air-feed steps in contact, removed |
|---|---|---|---|---|---|
| T1 | 1,733,353 mm³ | +0.22 % | +0.22 % | +0.22 % | none |
| T2 | 65,229 mm³ | +0.60 % | +0.30 % | +0.30 % | none |
| T3 | 26,515 mm³ | +0.28 % | +0.28 % | +0.58 % | none |
| T4 | 4,036 mm³ | −1.54 % | −1.54 % | 0.00 % | none |
| T6 | 67,556 mm³ | +1.07 % | +0.90 % | +0.90 % | none |
| T5 | 586.5 mm³ | −0.99 % | −0.99 % | −1.09 % | 1 step in each version, 0 mm³ |
The optimized files. V1's six programs (the optimizer splits lines where it re-interpolates the feed):
| Program | Lines, source → optimized | Feed words | Feeds written | Lines at the air feed | Lines at the 300 mm/min minimum |
|---|---|---|---|---|---|
| T1 | 30,992 → 38,513 | 10,162 | 300–20,000 mm/min | 106 | 10 |
| T2 | 9,404 → 9,542 | 182 | 1,809–20,000 mm/min | 20 | 0 |
| T3 | 49 → 75 | 36 | 391–20,000 mm/min | 5 | 0 |
| T4 | 39 → 44 | 10 | 400–20,000 mm/min | 5 | 0 |
| T6 | 5,110 → 5,435 | 378 | 300–20,000 mm/min | 59 | 14 |
| T5 | 21 → 29 | 9 | 1,247–20,000 mm/min | 2 | 0 |
In V3 the lowest feed written is each program's own lowest — T1 2,000, T3 1,500, T6 1,200 mm/min — and no line is at the minimum.
What the runs cost on the shared 32-thread server, server time and peak memory:
| Play | V1 | V2 | V3 |
|---|---|---|---|
| OP30 optimization play (plays the source, writes the optimized files) | 390.6 s, 24.13 GiB | 385.5 s, 23.82 GiB | 375.5 s, 22.77 GiB |
| OP30 replay | 235.3 s, 5.91 GiB | 245.3 s, 6.19 GiB | 240.3 s, 6.06 GiB |
| OP40 optimization play | 120.2 s, 6.98 GiB | 115.1 s, 6.95 GiB | 115.1 s, 6.11 GiB |
| OP40 replay | 75.1 s, 5.08 GiB | 80.1 s, 5.33 GiB | 75.1 s, 3.78 GiB |
| The version | 821 s | 826 s | 806 s |
The twelve plays took 2,453 s, 41 minutes; the fifteen sector trials 20 to 230 s and 1.7 to 17.8 GiB each, the 0.25 mm one the largest; the two picture plays on the sector 125 s and 95 s.
For a machining engineer. On a five-axis wheel program whose loads were already inside the spindle's rating, HiNC's optimization took 44.9 % off the machining time without changing the shape. On this wheel the ceilings given to each tool decide most of it, so they deserve the same care as a cutting parameter. Two settings make the result one to send to a machine: hold the finishing passes at their programmed feed, which here cost 25.7 s of the 469.6 s saved, and floor every step at its programmed feed, which made no line slower and saved 21.5 s more. The per-step log says which limit set each step, and the time-weighted histogram shows where the time went: most of the pocket tool's saving is in its ramps, which a shop would cap on its own.
For a teacher or a student. One program shows what this optimization held — spindle power, torque, tool stress, the ceiling — and what it did not: force, for which no target was set here; deflection, for which the optimizer has no criterion of its own; and the wall it leaves. It shows how a ceiling, a target and a floor decide a step together, why a finishing pass is protected, why a step is one revolution and a faster program has fewer of them, and why the ratio of two simulated times is the part to trust.
For someone weighing the approach. From six accepted programs to three optimized versions with their replays took twelve whole-wheel plays, 41 minutes of server time and at most 24 GiB, and fifteen sector trials. The agent wrote its criteria first, found on a trial that the force target did not hold the flank and changed the protection before the version ran, and wrote down where its predictions missed. What it leaves to an engineer are the ceilings and the ramps.
Honest limits
- The force target does not hold on this five-axis flank. Steps already above the target were still allowed the full ceiling; on the three-axis tools it held in part. The finishing passes are therefore held at their programmed feed rather than capped by a force target; the optimizer has no criterion for deflection itself.
- The gain rests on the agent's ceilings, typical values for carbide end mills and drills in aluminium, not a maker's data for these tools.
- Deflection is HiNC's tool-beam reading, and the removal geometry here does not include it. The projects play with HiNC's deflection transformation off, so the comparison with the design reads the programmed path and a finishing pass that bends more leaves no trace there; the deflection columns are the only place it shows.
- Chip evacuation, chatter and surface finish are not modelled. Most of T6's saving is in ramps into closed pockets.
- The first contact step of each level is written at the 300 mm/min minimum — in V1, 10 lines of T1 and 14 of T6 — though that step's own force is near zero (at most 0.19 N on T6 and 0.41 N on T1): all three criteria stop at the lower limit there. V3's floor keeps those lines at their programmed feed.
- An optimization setting embedded as a script comment can be broken by the optimizer's line note.
Where the optimizer appends its
(src(...))note to a line that carries an@@script, the replay reads the note as part of the script and reportsScript-Compile--Error. A sector trial with embedded force targets showed it on one and two lines; the programs on this page keep their held lines verbatim and carry no such note. - The times are HiNC's ideal-feed estimate, without acceleration, look-ahead or tool changes: the ratio between versions is sound, the absolute times are not shop-floor times — see Machining Time Estimation.
- The shape is read at 0.5 mm, which rounds edges: the five OP30 points below −0.3 mm are the same in every version and in the source.
- The machine, the spindle and the tools are generic, and the loads come from HiNC's library coefficients for 6061-T6; nothing was measured on a machine.
What a reader can take to their own case
- Mark the finishing passes before optimizing, and hold them with
BeginPreserve()…EndPreserve()when nothing else holds them; here it cost 5 % of the saving. - Check that a cap caps. Compare the feed each criterion allowed in the
per-step log with the step's load before
optimization; a target that never binds looks exactly like one that does. With
EnableDepthSplitionon, its default, a force row that repeats the step's own feed per tooth marks a step the target pinned on the floor, not one it let through. - Read which limit set each step. When it is your ceiling, the result is only as good as the ceiling.
- Floor a proven program at its own feed. At 100 %, the source-feedrate floor made no line slower than programmed and here also saved time, by keeping the smoothing above the programmed feed.
- Check the grid against the finishing allowance before trusting an optimization of a finishing pass: compare contact at two grids, and replay the optimized program on the finer one.
- Count what a criterion means. Removed volume says whether a faster program still cuts; step counts do not.
- Look where the saving comes from. A ramp feed that dominates a tool's time is a CAM decision to revisit, not only a gain to take.
- Budget the memory. An optimization play can need several times what its replay does: 24 GiB against 6 GiB for OP30 at 0.5 mm, though 7.0 against 5.1 GiB for the shorter OP40.
Source and licence
- Wheel size numbers: ANKUSI Open Wheel Fitment Dataset: bolt pattern, centre bore and OE wheel
specifications for 7,603 vehicle variants, ANKUSI Wheels engineering team, figshare, version 4,
2026-09-20, https://doi.org/10.6084/m9.figshare.33921994. Licence:
CC BY 4.0. Search terms if the link moves:
ANKUSI Open Wheel Fitment Dataset,figshare 33921994. - Flange height: de.wikipedia, Autofelge, “Form J, entspricht einer Höhe von 17,3 mm”.
- Attribution: “Wheel size numbers from the ANKUSI Open Wheel Fitment Dataset (ANKUSI Wheels engineering team, figshare, doi:10.6084/m9.figshare.33921994, CC BY 4.0). Wheel design by Tech Coordinate's agent.” The data set is provided as is, without warranty.
- What was used and changed: three numbers only; the CSV itself was not kept. The wheel design, the stock, the fixture, the machine, the spindle, every toolpath and the programs optimized here are the agent's, as the wheel's case page tells. The pictures are HiNC simulations and the charts are drawn from HiNC's per-step results. Everything on this page is simulated; no wheel was cut.
See Also
- A 17-Inch Forged Aluminium Wheel — how the wheel, its toolpaths and the programs optimized here were made and accepted
- NC Optimization — what the optimizer holds, and the source-feedrate floor
- Workflow: NC Optimization — the settings, held lines, embedded settings and the per-step log
- Optimization Results — measured before-and-after comparisons on other parts
- Machining Time Estimation — why the ratio of two simulated times is the part to trust
- Showcase — the other cases and how a case page reads