Ball-End Finishing in Five Directions: A Force Swing That Ranks Like the Measured Roughness, and a Form Error Tool Deflection Does Not Reach
A 2019 journal article finished two 42CrMo4 steel blocks, one with a convex and one with a concave R45 face, with the same 10 mm ball end mill in five raster directions, and measured the roughness Rz and the form errors of each face. The article published its results only as charts; it gives no CAD model and no NC program.
An AI agent rebuilt both parts from the article's drawing, wrote the ten finishing programs itself, built the projects through the HiNC web API and played all ten. The average cutting force changes by at most a fifth with the direction; how much the force swings along one pass changes far more, from 1 % along the cylinder axis to 31–49 % across it, and ranks the directions as the measured roughness does. A later paper by the same group measured the force of one direction; HiNC's force is within 3 % of it on the concave part and 27 % below it on the convex one. Along the surface normal these forces move the tip of the modelled tool by a few hundredths of a micrometre either way, about a thousandth of the measured form errors. On the way the agent met thirteen dilemmas, two of them defects in HiNC. This page is the record.
The case
The article — Balázs Mikó, Bálint Varga, Wojciech Zębala, “The Effect of the Feed Direction on the Micro- and Macro Accuracy of 3D Ball-end Milling of Chromium-Molybdenum Alloy Steel”, Materials 12(24), 4038 (2019), CC BY 4.0 — states:
- Two test parts, each 80 × 80 × 30 mm: CX with a convex, CV with a concave cylindrical face of R45, whose normal turns from 0° to 32.2° from vertical, joined to horizontal lands by R10 blends, with a 2 × 5 mm shoulder along two sides for measuring (its Figure 1).
- Material 42CrMo4 (1.7225) with Rm 1000 MPa and its composition.
- Finishing with a Fraisa X7450.450 ball end mill, Dc 10 mm, 4 flutes, at vc 160 m/min, n 5100 rpm, fz 0.08 mm, vf 1650 mm/min, ap 0.3 mm and ae 0.15 mm, the width of cut measured as the distance between paths in the x-y plane; zig-zag, up- and down-milling alternately, programmed in CATIA V5; roughing and pre-finishing first “in order to equal manufacturing allowances”.
- Five directions, A = 0°, 22.5°, 45°, 67.5° and 90° to the x axis, which runs along the cylinder axis: one part per direction, CX-1 to CX-5 and CV-1 to CV-5.
- Measurements, as charts only: the radius (Figure 5); Rz at each position and measuring direction (Figure 6); the average Rz per part (Figure 7); cylindricity and three kinds of surface profile error (Figure 8); and regression equations that tie cylindricity and profile error to the surface type, the direction and Rz. The article offers two explanations for the radius changes: the tool's deformation under a changing load, and a tool radius larger than nominal.
It does not give the CAD model, the NC programs, the path boundaries or CAM tolerance, the roughing and pre-finishing, the tool's helix, rake, flute length or overall length, the holder or stick-out, the coolant, the controller or the fixture, or any table of measured values.
A later open-access paper by two of the same authors (B. Varga, B. Mikó, Acta Technica Jaurinensis 16(1) 27–33, 2023, CC BY-NC 4.0) milled parts of the same design with the same tool at the same spindle speed and measured the force with a Kistler 5019 dynamometer, for A = 90° only and at three levels each of fz and ae. It names the holder, an SK40 cold press-fit chuck (PowerGrip), and flood coolant, and reports that the surface deviation it measured was largest where the force was largest. Its figures are not reproduced here; the facts its text states and values read off its Figures 8 and 9 (averages) and 11 (the force along a path) are cited with the reference.
What the agent built
Each value is marked read from the article or the 2023 paper, derived from them, chosen by the agent, or measured in a run.
- Section — derived. The R45 face to 32.2° reaches 45 sin 32.2° = 23.98 mm from the axis, where the article's Figure 6 places its 32.2° roughness positions. Tangent R10 blends back to horizontal give 8.459 mm from crown or trough to the lands. The cylinder axis is on the block's centre line (chosen). CX has its crown at Z 30 and lands at 21.541; CV has its lands at 30 and its trough at 21.541.
- Trimmed parts — chosen. Each part is a 10 mm band across the whole curvature (X 35–45, Y 2–80, from Z 10 up), so every direction crosses every surface normal the full part has. The full 80 × 80 parts were not played.
- Stock — chosen. The design offset 0.3 mm along the normal, a perfect pre-finish: the article does not describe its roughing and pre-finishing, and a real pre-finish leaves its own cusps.
- Target model — derived. The band's design, for HiNC's comparison of the cut stock with the design.
- Fixture and program zero — chosen. A 160 × 120 × 20 mm plate under the band; program zero at the article's corner under the two shoulders, on the block's bottom face, so the drawing's coordinates are the program's. The work offset G54 is set from the model after each reset.
- Programs — derived and chosen. Ten metric Fanuc programs, one per part and direction: parallel passes 0.15 mm apart in X-Y (read), alternating direction (read), the ball centre riding the design offset by 5 mm (every concave radius, R10 on CX and R45 on CV, is larger than the ball's 5 mm radius, so the ball cannot gouge), sampled every 0.25 mm and simplified to a 0.5 µm tolerance (chosen; the article gives no CAM tolerance), each pass running 5.5 mm past the stock with the turns in the air (chosen), S5100 and F1650 (read), M8 (read from the 2023 paper). Each program is 12.5–13.0 m of path, 7.6–7.9 minutes of feed.
- Tool — read and chosen. A distributor's list of the maker's article numbers gives a 10 mm ball, a 10 mm shank, 72 mm overall and an 11 mm flute. The helix (30°), radial rake (0°), relief (10°) and a 10 µm hone are chosen: the tool's own data sheet was not found. Cutter material WC-Co with 10 % cobalt; no coating, which in HiNC changes the friction heat and so the temperatures, not compared here.
- Holder and stick-out — chosen. A generic slim SK40 press-fit chuck (the type is read from the 2023 paper), Ø24 nose tapering to Ø33, Ø44 body, Ø63.5 flange, 80 mm gauge length; stick-out 20 mm by the rule max(flute, deepest cut) + 5 mm, rounded up to 5 mm; tool length 100 mm. At the deepest tip the holder nose stays 11.2 mm above the stock.
- Machine, spindle, controller — chosen. HiNC's shapeless generic three-axis machine, a synthesized 24,000 rpm spindle, Fanuc control; the article's Mazak 410 A-II is not modelled.
- Material — chosen. SCM440 from HiNC's library, the JIS equivalent of 42CrMo4, with its trained cutting coefficients and its yield as shipped (see the dilemma below).
- Mission — chosen. One step per spindle revolution, collision detection and physics on, the meshed STL stock recorded once per mesh width, one program per play on a fresh stock; mesh width 0.25 mm first, 0.03125 mm for the results.
How the agent managed the work
- Pass criteria first. Before the first play the agent committed, with every value above tagged read, derived or chosen, what a run must show and what it would compare. Build: every program to its last line with no message but the line count and no collision; steps within 10 % of one per revolution; the removal rate on the face within 15 % of vf × ae × ap; the depth about the 0.3 mm allowance; the cut stock within one cell of the design. HiNC's own trends: the force along a pass steadiest at 0° and least steady at 90° (the article's own explanation); the concave face loading the tool at least as much as the convex one; the axial force dominating a 90° pass, with the measured crown peak not expected to be reproduced. Against the measured charts: a rank correlation of HiNC's median normal tip deflection with the measured profile error of 0.7 or more would support deflection as the mechanism, expected low; the other comparisons reported, not judged.
- Coarse, then fine. The first plays were two directions at 0.25 mm, 10–15 seconds each; then 0.125, 0.0625 and 0.03125 mm on the same two, until the median force changed by less than 5 %; then all ten at 0.03125 mm.
- Every number checked against a second one. The removal rate summed over a run against the volume between stock and design; the exported cut stock against the design; the force against the 2023 measurement; HiNC's tip deflection against a beam formula. Two of these checks found defects.
- One comparison added after the runs, and marked as such. Setting the force's swing along a pass against the measured roughness was not among the criteria written beforehand; the criteria only predicted its order within HiNC.
- A review of the written claims. A second agent checked every sentence of this page against the run files, the two papers and the engine source; its findings corrected the sign argument about deflection, the account of the criteria, and several numbers.
- Reading the engine. Where a number looked wrong, the agent read the HiNC source that computes it before deciding whether to use it.
- A private server copy on a shared machine. The agent ran its own copy of the deployed HiNC 3.2.42 on a 32-thread Linux server that other agents used for other cases at the same time, in its own folder with its own copy of the case repository.
The dilemmas
Each dilemma is told as its situation, the risk, how it was noticed, the resolution, and the evidence.
Two papers, two sections
- Situation. The 2019 article gives the face's normal range, 0° to 32.2°, and the R10 blends; the 2023 paper says the cylindrical part is 9.2 mm high and the lands 10 mm wide.
- Risk. Building from a mix would put the blends a millimetre off either paper.
- Noticed. The section derived from 32.2° with tangent blends is 8.459 mm high with 10.69 mm lands; no tangent section satisfies all three values.
- Resolution. Follow the 2019 article, the case's own source, whose Figure 6 marks 32.2° at ±24 mm, and record the discrepancy.
- Evidence. The difference moves only the blends, by about 1 mm; the face and the lands, where the comparison is made, are the same either way.
A tool with no data sheet
- Situation. The article names the Fraisa X7450.450 and gives its diameter and flute count. Neither the maker's web shop nor its 2011/12 catalogue lists the X7450 series.
- Risk. A guessed flute length or shank changes the holder clearance and the stick-out; a guessed rake turns the direction of every edge element's force.
- Noticed. The shop and the catalogue list other series with the same size code, never X7450.
- Resolution. A distributor's list of the maker's article numbers gives
X7450450 ø10/10x72/11: a 10 mm ball, 10 mm shank, 72 mm overall, 11 mm flute. The helix, rake, relief and hone are the usual values for a four-flute carbide ball end for steel and are marked as chosen. - Evidence. The listed diameter agrees with the article's Dc 10. The chosen geometry was not varied; every direction uses the same tool, and how much the choice moves the split of the force between the axis and the side is not measured.
Where to trim
- Situation. Ten full parts at the fine mesh would multiply the run time by about eight.
- Risk. A trim that keeps only part of the curvature would compare directions on different surface normals.
- Noticed. The rule of thumb for steps and memory, applied to the full parts before building.
- Resolution. A 10 mm band along the cylinder axis, across the whole curvature, for every part; passes start and end outside the stock so no pass plunges.
- Evidence. Every direction's band covers 0° to 32.2° of the face, the blends and the lands; a run took under two minutes.
A yield strength that was not a yield strength
- Situation. The plan written when the case was gathered said to raise the library material's yield to Rm 1000 MPa.
- Risk. Editing a material value the force does not use, and calling the result calibrated.
- Noticed. Rm is the tensile strength, not the yield; in HiNC's source the workpiece yield enters only the workpiece plastic depth, not the cutting force.
- Resolution. The library's SCM440 as shipped (tensile yield 785 MPa).
- Evidence. The force and every quantity compared on this page are independent of that value.
The measurements are charts
- Situation. Every measured value the comparison needs is a point on an Excel chart in the PDF.
- Risk. Values read by eye carry an unknown error and cannot be rechecked.
- Noticed. No table in either paper.
- Resolution. A script reads the images embedded in the PDF: the gridlines give the scale, the five categories sit at the centres of five equal bands, and each series is found by its colour. Its first version took the axis labels for part of the plot and read every point half a category off; a check image with a cross on each point showed it. A point hidden under another series' marker was read from the one line segment beside it; a series drawn almost entirely under another (four points of Figure 5) was left unread.
- Evidence. Half a pixel is 0.01 µm of Rz and 0.1 µm of form error. Put into the article's own regression for cylindricity, the Rz read for the convex part at 0° gives 0.0086 mm, where the article's Figure 10 plots the estimate for that part at about 0.0085 mm.
The agent's program drove the tool into the fixture
- Situation. The first 0.25 mm play raised a stroke-limit error, 27 stroke warnings and 14 collisions: the flute, the shank and the holder with the fixture plate, and the holder with the stock.
- Risk. Taking a program error for a set-up error, and moving the part.
- Noticed. The collisions came at the end: the agent had written
G49, cancelling the tool length, and thenG0 Z50., which puts the spindle's gauge line at Z 50, so the tip went to Z −50. - Resolution. The programs end at the safe height with the length offset still on.
- Evidence. From then on every run holds only the one expected message per program.
More steps than revolutions
- Situation. At one step per spindle revolution the 0° programs took 39,292–39,296 steps, 1.3 % over the estimate; the others took 46,492–46,976, 16–20 % over.
- Risk. Reading the extra steps as extra machining time or as a defect.
- Noticed. HiNC makes at least one step per NC block, and the other programs have many blocks shorter than one revolution's feed of 0.32 mm, on the curved stretches and in the turns along the margin.
- Resolution. Recorded as how the step mode works; the criterion written as ±10 % holds only for the 0° programs.
- Evidence. The simulated times, 7:38 to 7:53, are within a few seconds of the feed time of each program's path.
A removal rate eight times the material
- Situation. At 90° HiNC reported removal-rate peaks of 31–49 mm³/s at every mesh width, where the nominal rate is 1.24 mm³/s.
- Risk. Reading the removal rate, or the removed volume the rapid-move monitor derives from it, as material.
- Noticed. Summed over a run, the removal rate times the step duration should equal the volume between stock and design, 243.6 mm³. At 0° it came to 389, 327, 299 and 287 mm³ from 0.25 to 0.03125 mm, still falling with the mesh width; at 90° to 1,891 mm³ at 0.03125 mm. Binned by the surface normal, the 90° excess grew from 1.4 times on the convex crown and 1.8 times in the concave trough to 16 and 18 times on the 32° slopes, while the force in the same steps did not rise.
- Resolution. HiNC's source projects the contact patch's area on the travel direction after dropping its upward component and flipping its downward one, so that only downward motion counts as removing; on a slope the part of the contact patch facing the finished surface enters the sum. Filed as a defect; the case compares the force, which does not read the removal rate.
- Evidence. The exported cut stock settled that the geometry is right: at 0.03125 mm it sits 0.55–0.94 µm (median) above the design in every direction, 95 % of it within 2.7 µm and all of it between −0.5 and 4.5 µm.
A tip deflection forty times too small
- Situation. HiNC's tip deflection for this tool is about 0.01 µm under per-revolution force peaks of 20–40 N.
- Risk. Comparing a deflection that is off by a factor of forty with a measured form error.
- Noticed. For the modelled tool the beam formula (the integral of z²/(E I) along the stick-out) gives 0.0204 µm/N. HiNC sums a cantilever term per profile segment with no lever arm to the tip, a defect already filed from an earlier case; recomputed with HiNC's formula, its coefficient for this tool is 5.1 × 10⁻⁴ µm/N, about 2.5 % of the beam value.
- Resolution. The normal deflection is computed from HiNC's per-revolution average force with the beam-formula compliance, 0.0204 µm/N sideways and 0.00233 µm/N along the axis; HiNC's own value is reported beside it.
- Evidence. HiNC's own tip deflection divided by the recomputed coefficients gives back 0.94–0.96 of each step's per-revolution peak force (5th to 95th percentile over 23,102 steps), so the recomputed coefficients are the ones HiNC applies.
Which force to compare
- Situation. HiNC reports, per revolution, the average force vector and the peak force; the 2023 paper filters its 2 kHz signal with 25-sample means.
- Risk. Setting a peak against an average, or one pass against a whole surface, and calling the difference a model error.
- Noticed. 25 samples at 2 kHz are 12.5 ms, about one revolution at 5100 rpm.
- Resolution. The paper's resultant is compared with the magnitude of HiNC's per-revolution average force, over whole passes, up-milling and down-milling apart, as the paper does.
- Evidence. The concave part then agrees within 3 %; the convex part is 27 % low (see Results).
A depth peak that is not the depth
- Situation. The depth-of-cut peaks were 0.74–1.45 mm for a 0.3 mm allowance.
- Risk. Reading them as a gouge.
- Noticed. HiNC's depth of cut is the height of the contact outline in the tool's frame; on a slope a ball's outline is taller than the allowance.
- Resolution. The depth is not used for acceptance; the medians, 0.41–0.49 mm, are reported.
- Evidence. The cut stock shows no gouge (the residual above).
A picture needs a program that stops
- Situation. The first picture showed the tool 20 mm above the part and the part in the comparison's green.
- Risk. A picture without the tool in the cut, or one that shows the comparison instead of the force.
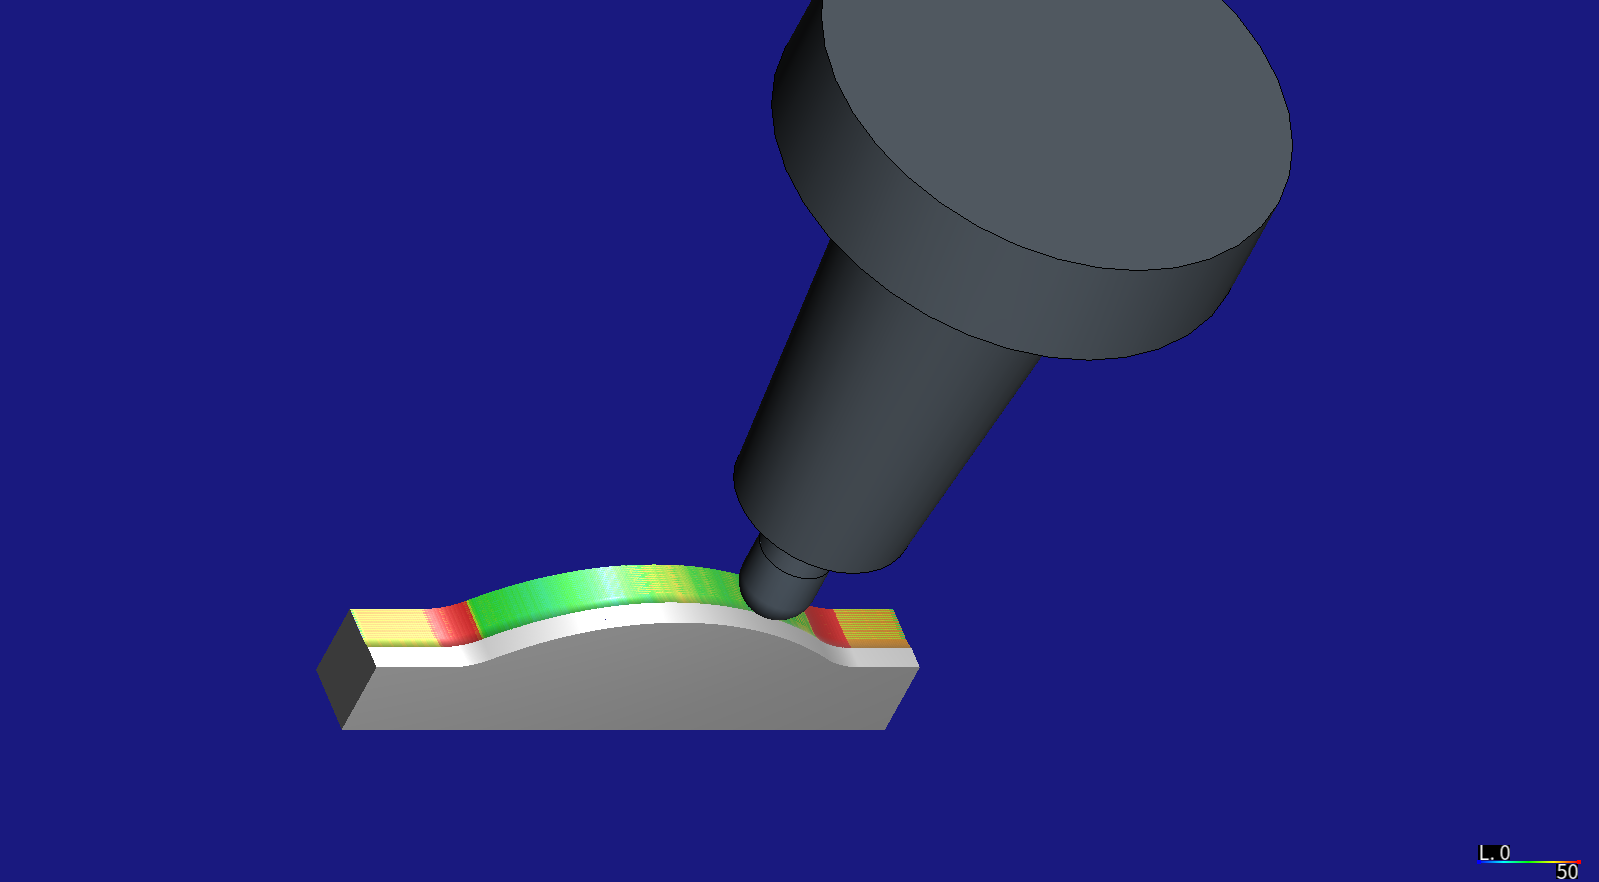
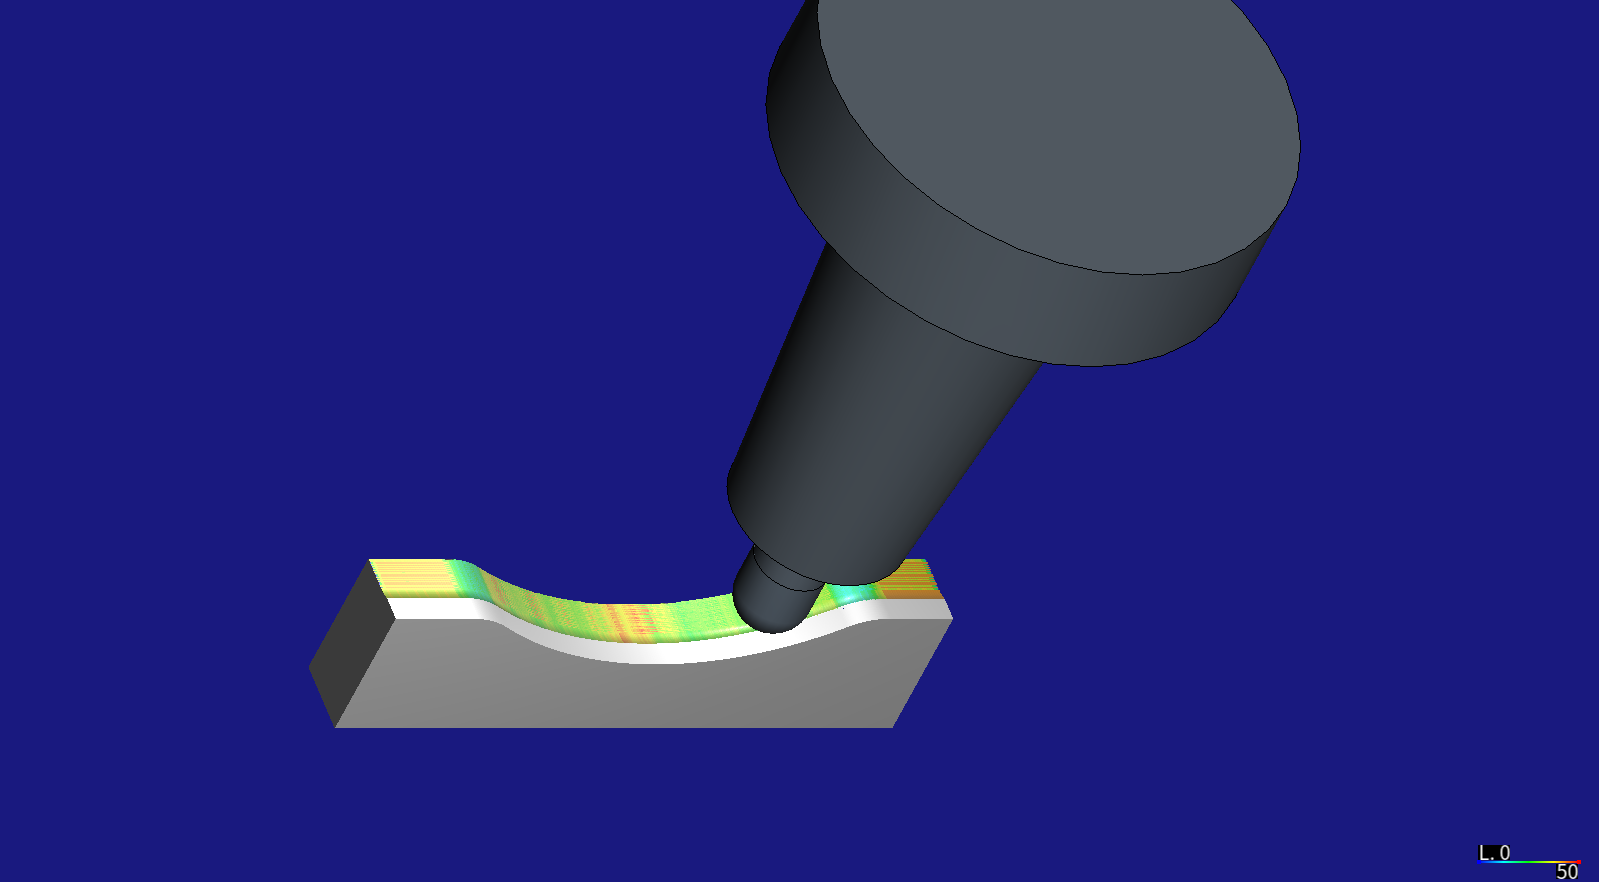
- Noticed. The canvas draws the tool where the run ends, not at the step selected; and the colour of the geometry comparison takes precedence over the colour of a chosen quantity.
- Resolution. Two extra programs stop the 90° raster on the face; played without the comparison, they leave the ball on the surface and the finished half of the band coloured by force.
- Evidence. The two pictures on this page.
A shared folder the agent could not write
- Situation. The shared server holds one copy of the case repository that the other agents also use.
- Risk. One agent's files or a half-finished commit getting into another's.
- Noticed. Writing into that copy was refused.
- Resolution. The agent worked in its own sparse copy of the repository and committed only its case's paths from there.
- Evidence. Every commit of the case touches only its own folder and its own tools.
Results and benefits
Everything here is simulated; no part was cut. Measured on HiNC 3.2.42 at a mesh width of 0.03125 mm. Force is the magnitude of the per-revolution average force; “core” is the band's middle (contact X 37–43) on the face and blends; the swing is the standard deviation over the mean along each pass, medianed over passes; the normal deflection is HiNC's force times the beam-formula compliance of the modelled tool, projected on the design normal (positive away from the surface).
| Part | A | Force, median (N) | Axial force (N) | Swing along a pass | Normal deflection, p10 / p90 (µm) | Measured Rz (µm) | Measured profile error (mm) |
|---|---|---|---|---|---|---|---|
| CX | 0° | 10.8 | 2.5 | 1 % | −0.050 / 0.034 | 3.2 | 0.013 |
| CX | 22.5° | 9.8 | 2.4 | 6 % | −0.049 / 0.018 | 4.7 | 0.012 |
| CX | 45° | 9.2 | 2.3 | 10 % | −0.060 / 0.024 | 5.6 | 0.019 |
| CX | 67.5° | 8.7 | 2.3 | 13 % | −0.044 / 0.029 | 6.8 | 0.032 |
| CX | 90° | 8.7 | 2.4 | 49 % | −0.034 / 0.030 | 7.9 | 0.034 |
| CV | 0° | 10.7 | 2.7 | 1 % | −0.050 / 0.034 | 4.2 | 0.040 |
| CV | 22.5° | 10.8 | 2.6 | 8 % | −0.057 / 0.018 | 5.9 | 0.044 |
| CV | 45° | 10.7 | 2.5 | 12 % | −0.063 / 0.025 | 5.7 | 0.044 |
| CV | 67.5° | 10.4 | 2.6 | 16 % | −0.054 / 0.031 | 6.3 | 0.053 |
| CV | 90° | 10.5 | 2.6 | 31 % | −0.042 / 0.037 | 6.0 | 0.053 |
The measured values are read off the article's Figures 7 and 8(b). Over the five directions, the rank correlation of HiNC's swing along a pass with the measured average Rz is 1.0 on the convex part and 0.8 on the concave; with cylindricity 1.0 and 0.9; with the profile error 0.9 and 0.95. With five points only 0.9 and 1.0 pass a one-sided test at 5 %, and any quantity that rises or falls steadily with the direction ranks the convex part as perfectly: the average force scores −1.0 there. So the swing is consistent with the article's explanation, not proof of it. The criterion written beforehand — HiNC's median normal deflection against the profile error — gave 0.9 on the convex part and 0.63 on the concave; the first passes the threshold on paper, but the values it ranks are 0.003–0.006 µm, too small to be the mechanism. The per-revolution change of tip deflection that HiNC's Surface Roughness chart plots ranks opposite to Rz (−1.0 and −0.8). The build criteria held except three: the non-zero directions' step counts, the removal rate (see the dilemmas; at 0° its sum is still 18 % high at the finest mesh), and the depth peak.
Against the 2023 measurement, A = 90°, fz 0.08 mm and ae 0.15 mm (the 2019 conditions), whole passes:
| HiNC, up / down milling | Measured, up / down (read off its Figure 8) | HiNC, deviation along a pass | Measured (its Figure 9) | |
|---|---|---|---|---|
| Convex | 10.9 / 10.7 N | 14.9 / 14.4 N | 4.7 N | 6.5 / 7.0 N |
| Concave | 10.9 / 10.6 N | 10.6 / 11.0 N | 3.2 N | 6.4 / 6.5 N |
Along a 90° pass on the convex part HiNC's force is highest in the R10 blends (20–31 N over about 3 mm), about 14 N on the lands, 7–8 N on the slopes and 11 N on the crown. The 2023 paper's force curve for its setting No. 1 (fz 0.08 mm, ae 0.35 mm) is also high on the lands, drops on the slopes and rises to a crown peak three to four times the slope force, where HiNC's crown is 1.4 times; the paper finds the axial force dominant, where HiNC's is 2.3–2.6 N of about 10 N.
The ten runs are clean: every program played to its last line, the only message per program is the expected line count, and no collision was reported. Each run took 85–120 seconds on a 32-thread server; the instance that played the ten in a row grew from 1.3 to 5.1 GB; the whole case at 0.03125 mm took about 20 minutes.
- For a machining engineer. For a fixed stepover, depth and feed, the raster direction changed the swing of the load along a pass far more than its level (up to a fifth), and the directions with the steadiest load had the lowest measured Rz and cylindricity. A simulation can rank directions by that swing before cutting. It cannot give the Rz or the form error, and the measured form error of 10–53 µm (cylindricity and profile error without datum) is not the modelled tool's deflection, which moves the tip along the normal by −0.06 to +0.04 µm for 80 % of the steps here. The form error is already 10–40 µm at 0°, where each pass holds Z constant, so whatever causes it acts in every direction; the article's own candidates are the tool's deformation and a tool radius larger than nominal, and others outside the model — the machine and holder compliance, contouring error on the passes that move Z, thermal drift, runout, wear, the measurement — were not tested here.
- For a teacher or a student. The stepover cusp of a ball of 5 mm radius at 0.15 mm is 0.56 µm and the feed mark 0.16 µm, while the measured Rz is 3–8 µm: the roughness here is not geometric. Where the load on a ball end comes from, why the contact point moves on the ball when the raster crosses the curvature, and why a simulated force of about the right size can still split wrongly between the axis and the side of the tool.
- For someone weighing the approach. The agent rebuilt a paper-only experiment, wrote the CAM programs itself, checked each number against a second one and had its claims checked by a second agent, and reached a result that separates what a force model can answer from what it cannot. The runs cost minutes; the reading of the article, the second paper and the engine took most of the work.
- What changed in HiNC and in this documentation. Filed: the removal rate on sloped 3D passes. Added to an open defect: this tool's tip-deflection coefficient against the beam formula. Corrected: the Surface Roughness paragraph of Machining Issues Outside the Model, which said a comparison with such measurements could use the chart's trend; in this case the chart's trend ran opposite to Rz.
Honest limits
- No roughness and no form error. HiNC does not compute Rz, cylindricity or profile error; the comparison is of rankings, over five directions, which cannot tell one steadily varying cause from another.
- No machine dynamics, no machine or fixture compliance. HiNC moves the axes at the programmed feed with no servo lag, acceleration or look-ahead; the spindle, holder, part and fixture do not deflect. See Machining Issues Outside the Model.
- Deflection does not move the cut. In HiNC 3.2.42 tool deflection is an output only; the cut stock is the rigid tool's, and the deflection shown here is computed outside HiNC from its force, for the tool alone. It grows with the chosen 20 mm stick-out: at 40 mm the modelled tool's compliance is 4.2 times larger, which would still keep 80 % of the steps within about a quarter of a micrometre.
- The force is close in size, not in its parts. HiNC's average force is 27 % below the 2023 measurement on the convex part and its swing along a pass 30–50 % below; the axial share and the crown peak are much smaller in HiNC. The ploughing of the ball's tip, where the cutting speed tends to zero, is not modelled, and the chosen rake and helix also turn the force.
- A trimmed band, a perfect pre-finish. The band is 10 mm of an 80 mm part; the stock is an exact offset of the design, where a real pre-finish leaves cusps.
- Assumed, not read. The section's centring, the tool's helix, rake, relief and hone, the holder dimensions, the stick-out, the machine, the spindle and the material coefficients are the agent's choices.
- Measured values read off charts. Every measured number is a reading of a published chart, not a value the papers print. The 2023 force was measured at A = 90° only, on parts of the same design.
- The removal rate. HiNC 3.2.42 overstates the removal rate of passes that climb or descend a slope, up to 18 times in this case, and even on level passes its sum was 18 % high at the finest mesh; the cut geometry and the force are not affected.
What a reader can take to their own case
- Sum the removal rate over a run and compare it with the volume between stock and design; export the cut stock and measure it against the design. Two numbers that should agree find defects.
- Compare a simulated force with a measurement only after matching how each was averaged; here one revolution on both sides.
- When a paper gives only charts, digitise them with a script and check the reading against a relation the paper prints.
- Before explaining a form error with tool deflection, compute its size along the surface normal.
- With a handful of directions, a rank correlation cannot pick one cause from several that vary the same way; write down beforehand which comparison decides, and say which ones came later.
- End an NC program at a safe height before cancelling the tool length, and read the first coarse run's messages to the last one.
Source and licence
- Source. Balázs Mikó, Bálint Varga, Wojciech Zębala, “The Effect of the Feed Direction on the
Micro- and Macro Accuracy of 3D Ball-end Milling of Chromium-Molybdenum Alloy Steel”, Materials
12(24), 4038 (2019), https://doi.org/10.3390/ma12244038 (article page
https://www.mdpi.com/1996-1944/12/24/4038; open-access copy PubMed Central PMC6947425). If the
link moves, search for
ma12244038or the title. - Licence. Creative Commons Attribution 4.0 International (CC BY 4.0), as the article's last page and its PubMed Central record give it.
- Attribution. Test-part dimensions, cutting conditions and measured values after B. Mikó, B. Varga, W. Zębala, “The Effect of the Feed Direction on the Micro- and Macro Accuracy of 3D Ball-end Milling of Chromium-Molybdenum Alloy Steel”, Materials 12(24), 4038 (2019), https://doi.org/10.3390/ma12244038. © 2019 by the authors. Licensee MDPI, Basel, Switzerland. Licensed CC BY 4.0, provided as is, without warranty. The authors do not endorse this case or HiNC.
- Also cited. B. Varga, B. Mikó, “Investigation of the cutting force and surface profile error when free form milling”, Acta Technica Jaurinensis 16(1) 27–33 (2023), https://doi.org/10.14513/actatechjaur.00685, CC BY-NC 4.0: facts stated in its text and values read off its Figures 8, 9 and 11 only; none of its material is reproduced.
- What was changed. Nothing in the article. The section, the trimmed band, the stock, the ten programs, the tool's unstated geometry and the holder were derived or chosen for this case, and the measured values were read off the published charts by a script; Figure 3 of the article is not used. The pictures are HiNC renders. The reader fetches the article from the source; the company site keeps a backup copy of the original file.
See Also
- Showcase — the other cases and how a case page reads
- Machining Issues Outside the Model — roughness values, machine error and other effects the simulation leaves out
- Strip Charts — the Surface Roughness chart and what it plots
- Cutter Geometry — holder profile, stick-out and tool length
- Project Construction — the build order the agent followed
- Replay Acceptance over the HTTP API — the evidence a run is accepted on