Introduction
Role of HiNC
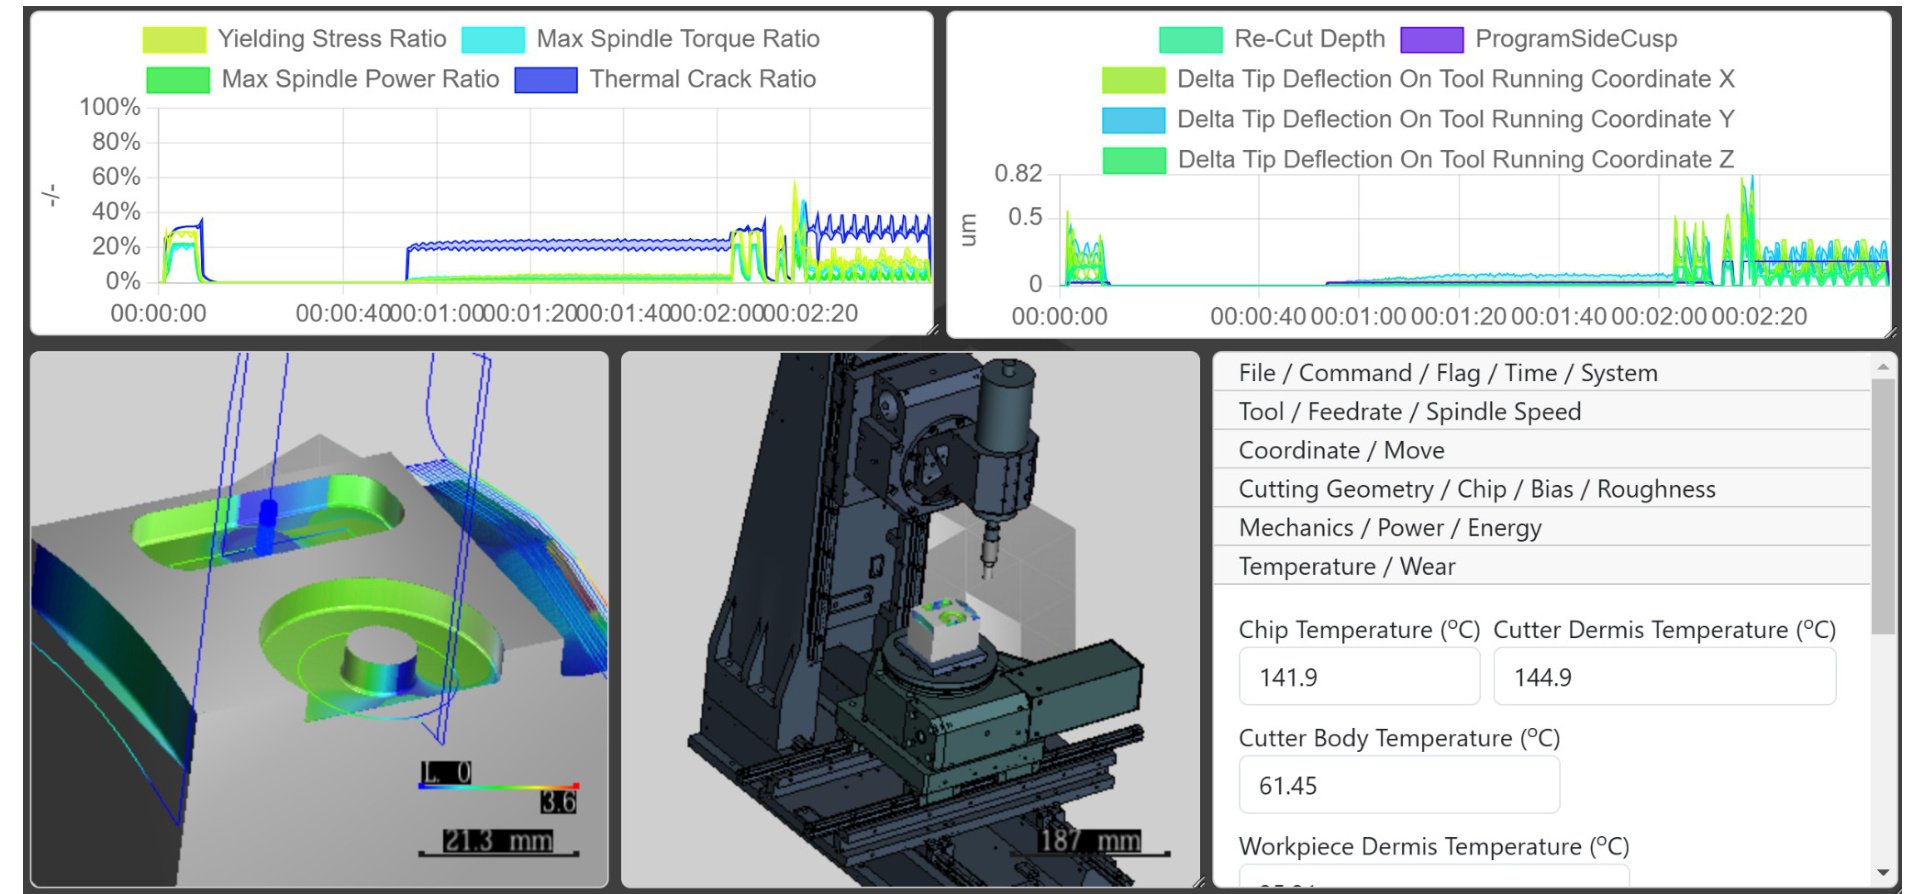
HiNC performs pre-machining verification and optimization of NC/CL data from CAM systems through high-precision simulation and sophisticated physical analysis.
The arrow is Workflow and Feasibility Feedback.
Parameters for Analysis
Those parameters should be set for physics simulation.
-
Machine Configuration
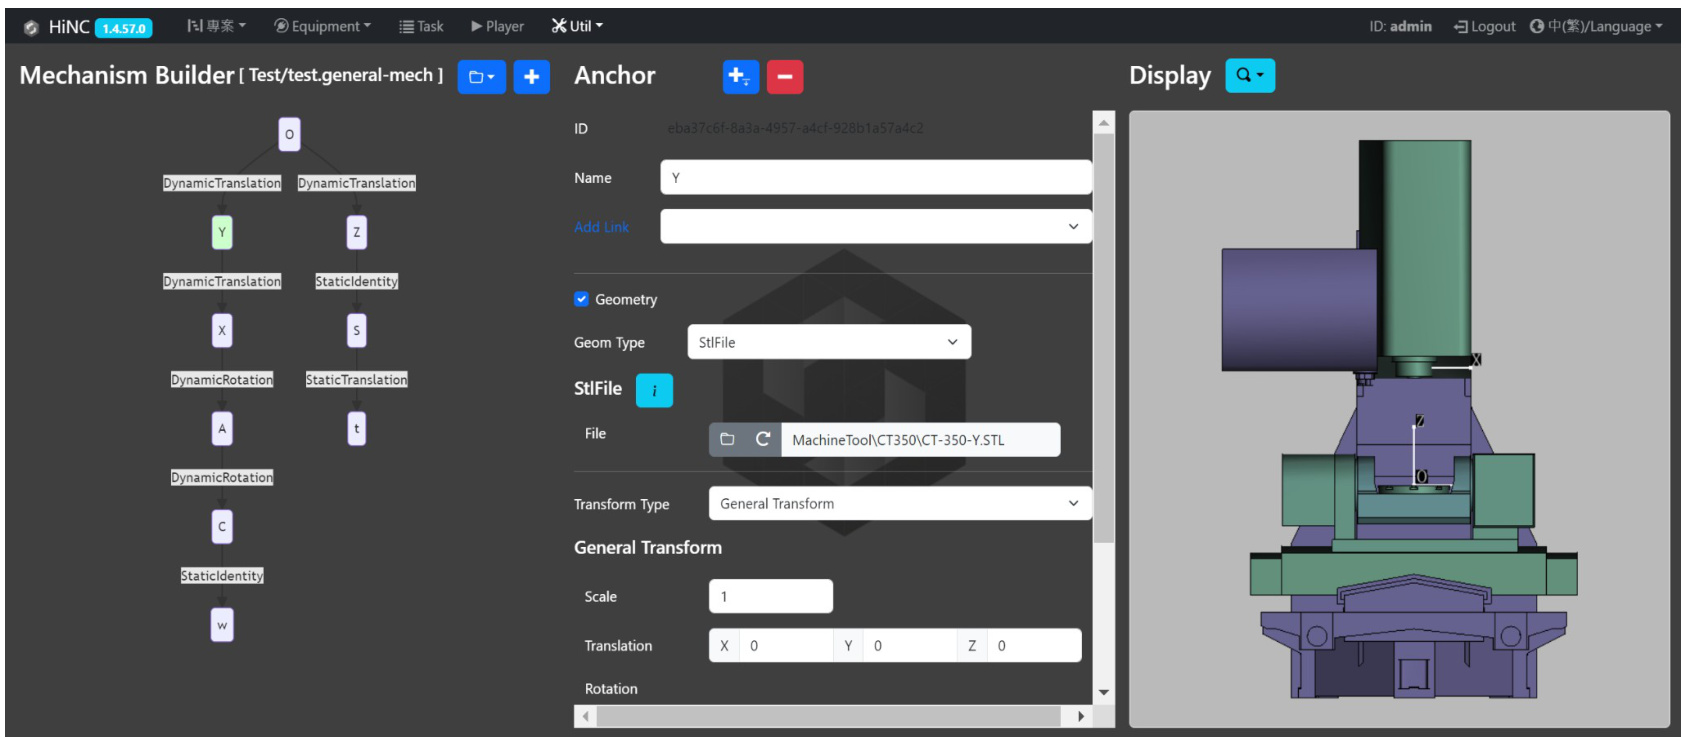
- Simplified component CADs
- Motion methods
-
Spindle
- Speed-power-torque diagram
-
Environment
- Background temperature
- Coolant capacity
-
Workpiece
- Initial CAD and Finished CAD
- Workpiece Material
- Fixture CAD
-
Tool
- Holder CAD
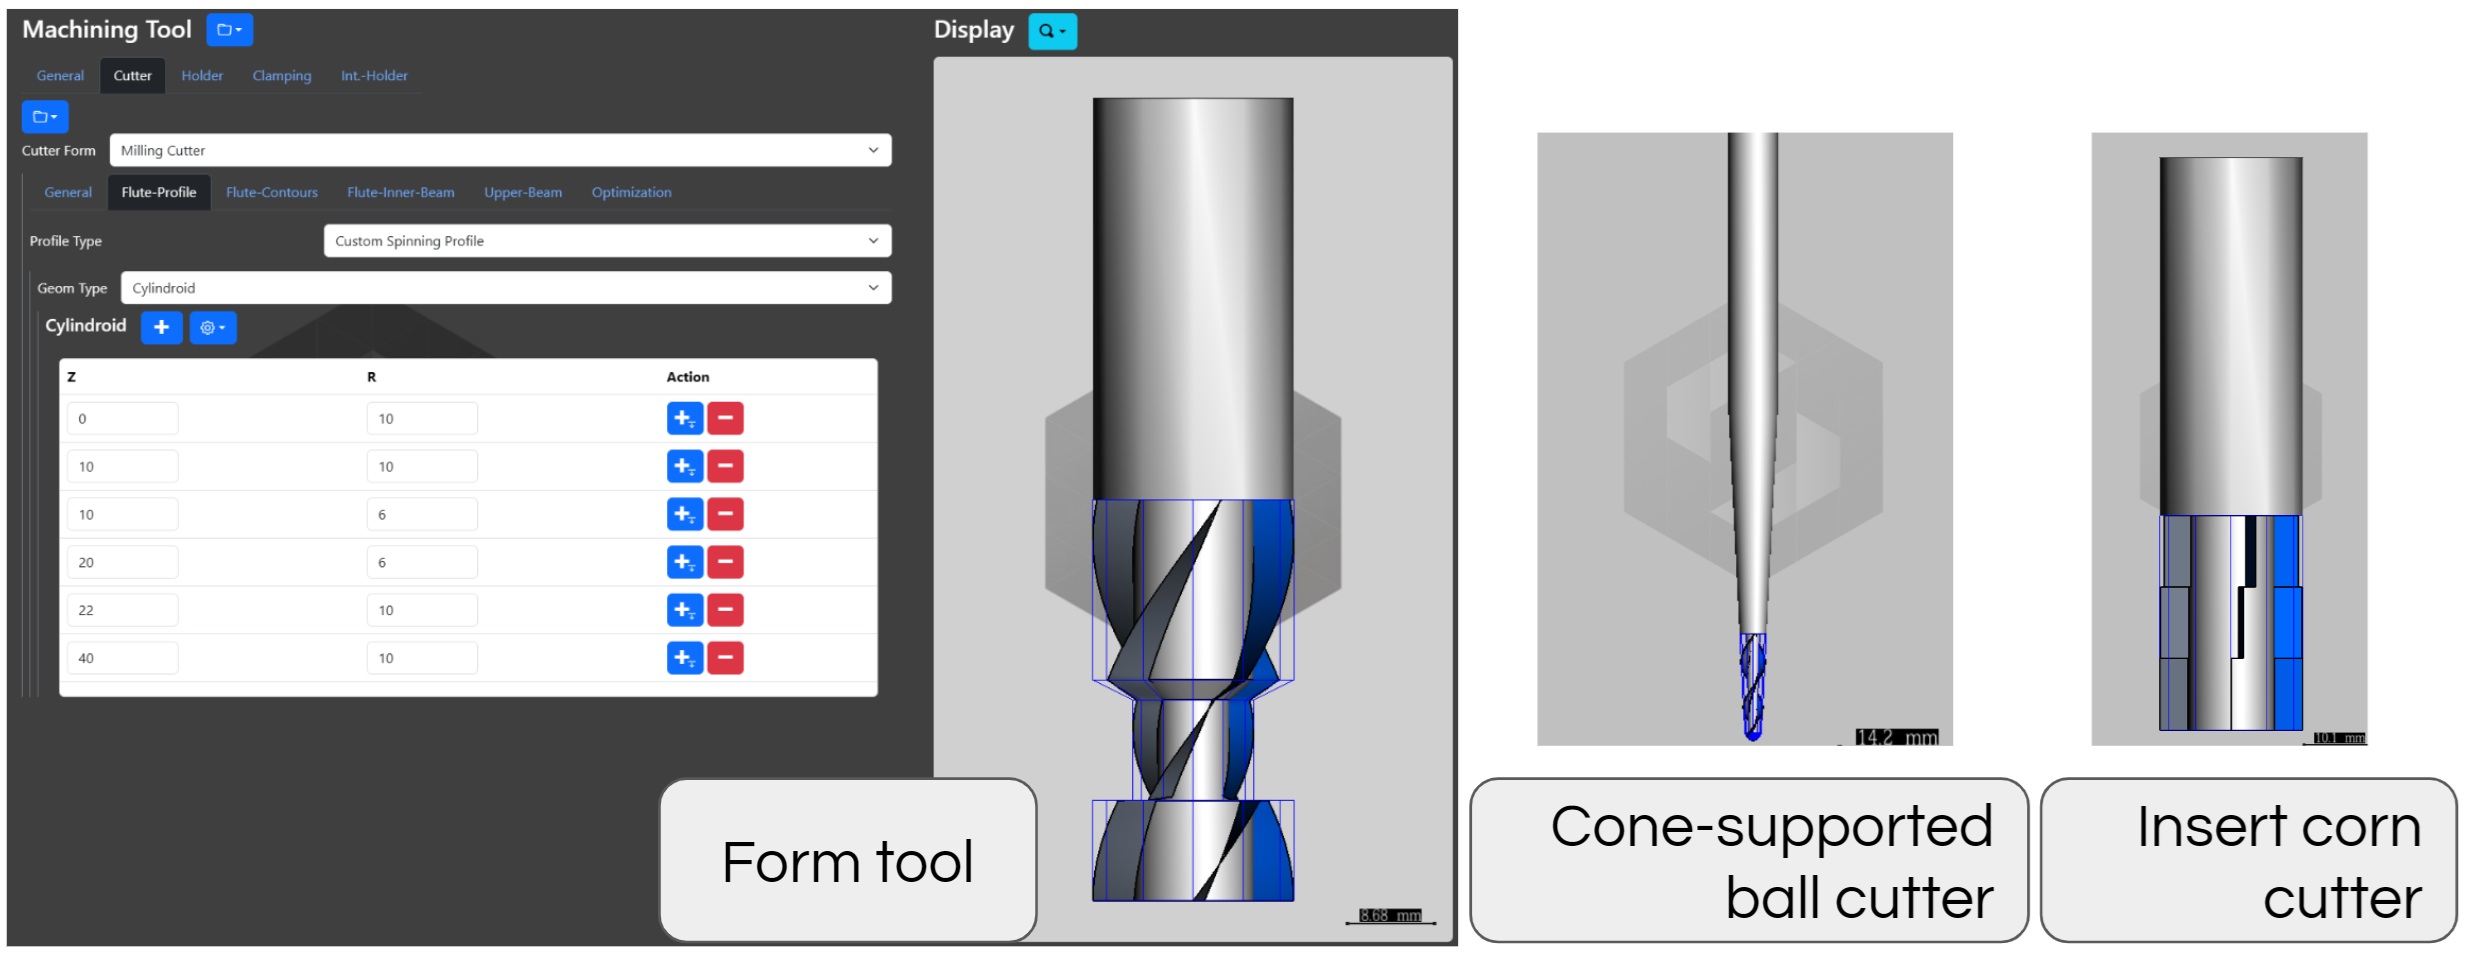
- Cutter geometric parameters
- Cutter and Coating Material
-
Controller
- NC / CL program
- Program origin
Physical Simulation, Verification and Applications
Performance & Showcase
Physical Properties Evaluation
Physical Properties Evaluation is based on cutting force analysis.
This is a simplified representation of the physical properties evaluation mechanism. The actual system involves complex interactions between multiple characteristics.
Cutting Parameter Training
Cutting Parameter Training is a one-time calibration process for each workpiece material. HiNC's integrated material database enables immediate application of cutting force analysis.
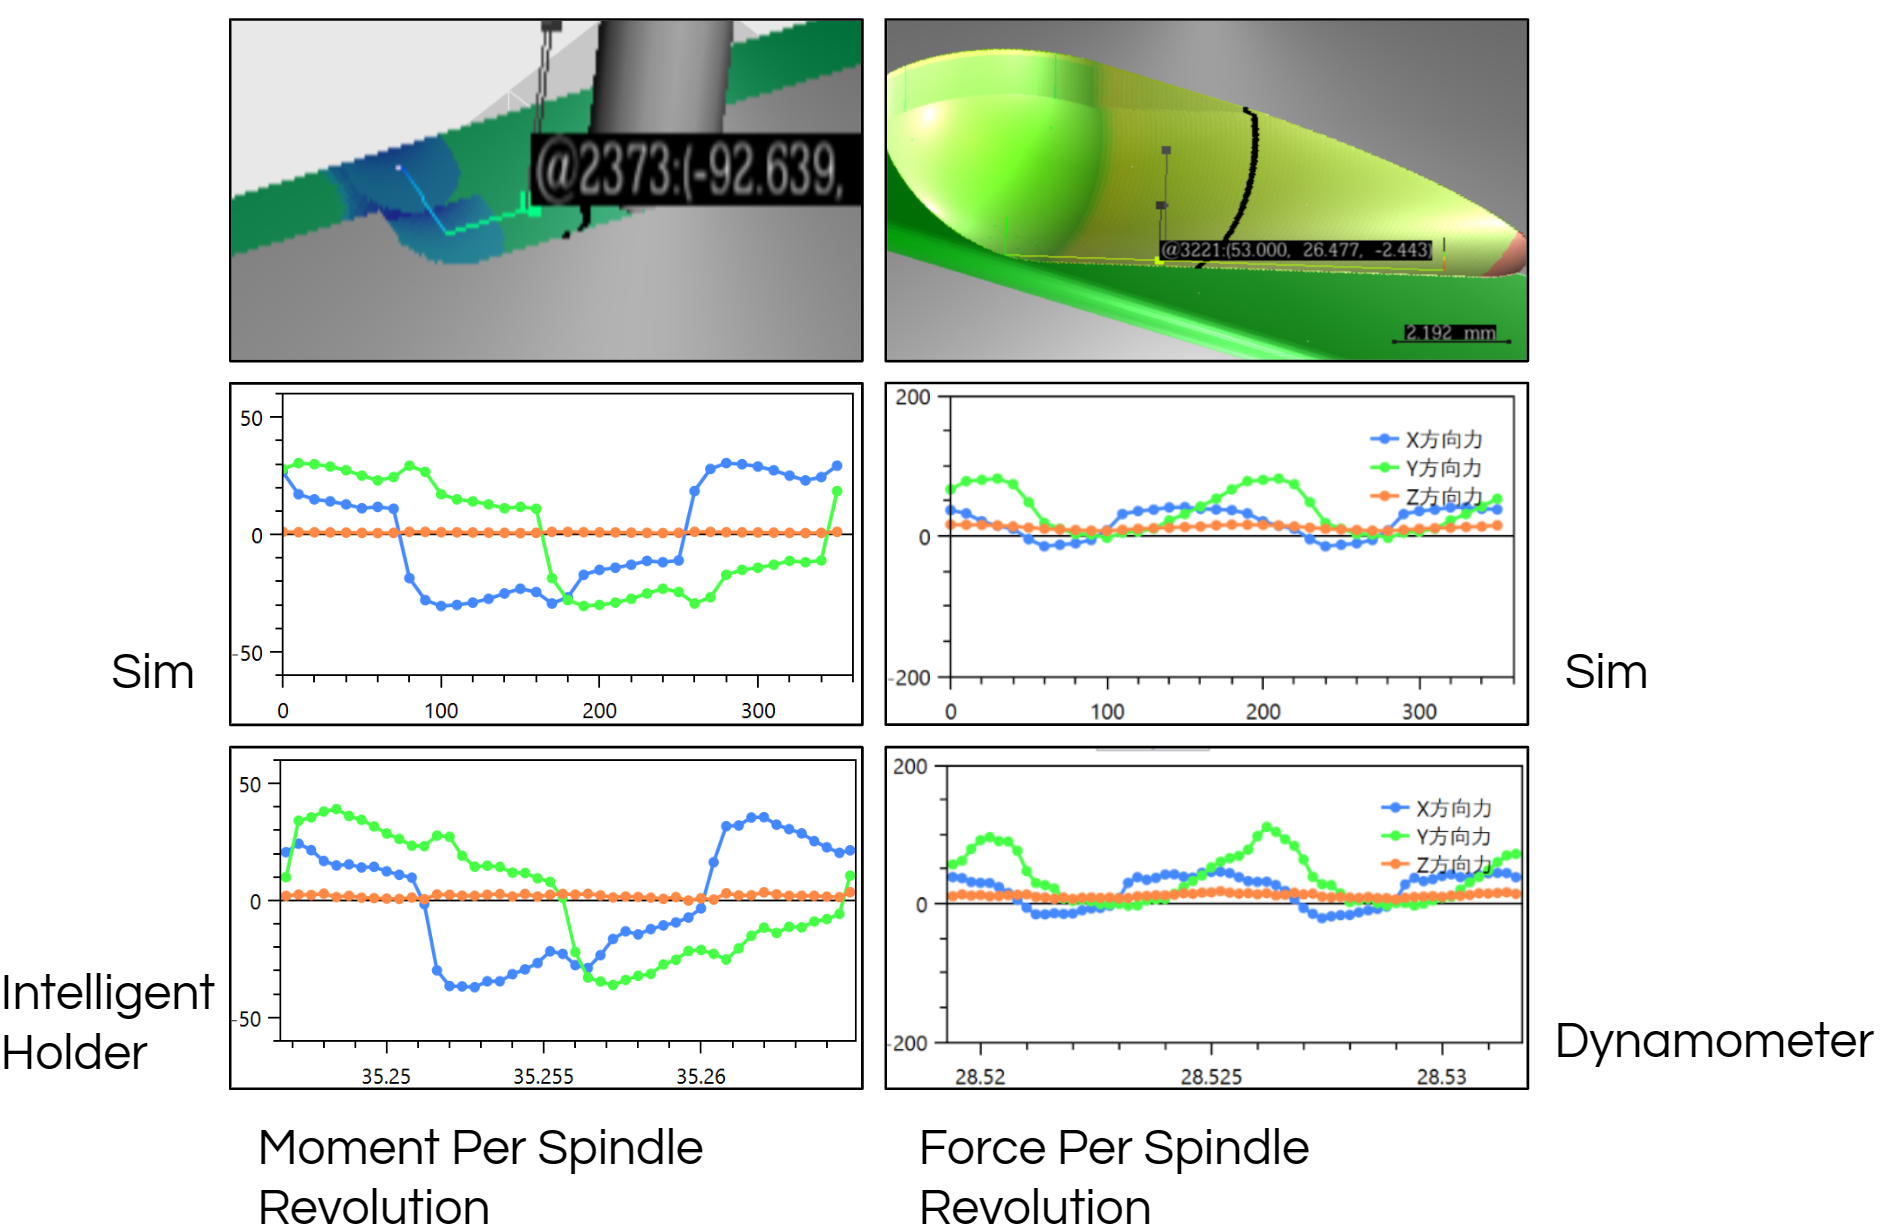
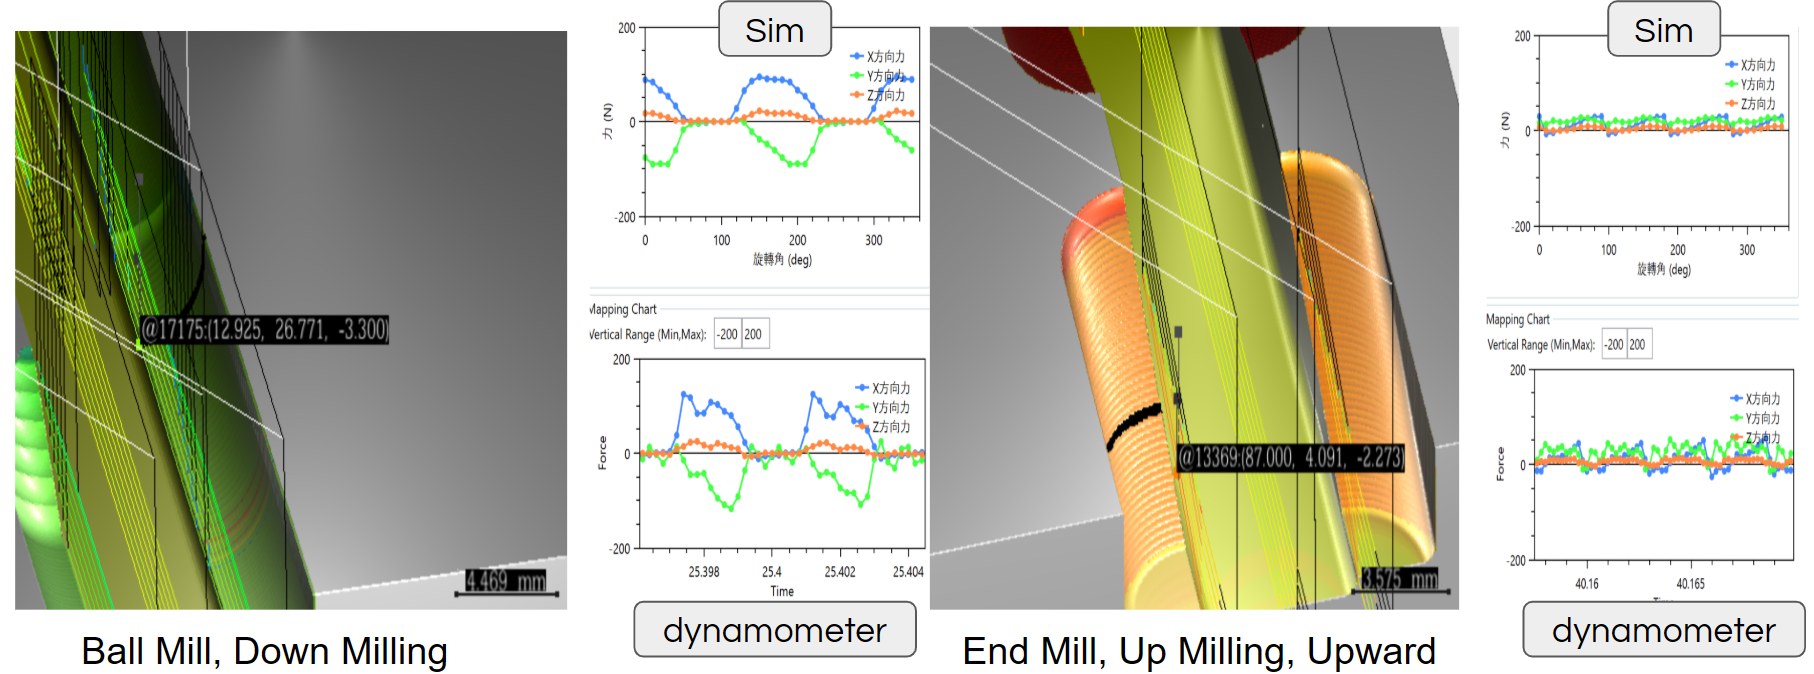
Simulation and Measurement Correlation Coefficient 0.99
- New tool correlation coefficient usually ranges from 0.9 - 0.999. Homogeneous brittle materials typically exhibit higher correlation, usually above 0.95.
- For same material, simulation error between different tool types (e.g. ball mill vs end mill) usually 10% - 25%. Different hone radius typically results in similar error ranges, though in rare cases the error may reach up to 40%.
- Abnormal cutting causing low yield in machining site, such as tool breakage, usually has cutting force about tens of times the average.
Cutting Force Simulation Validation
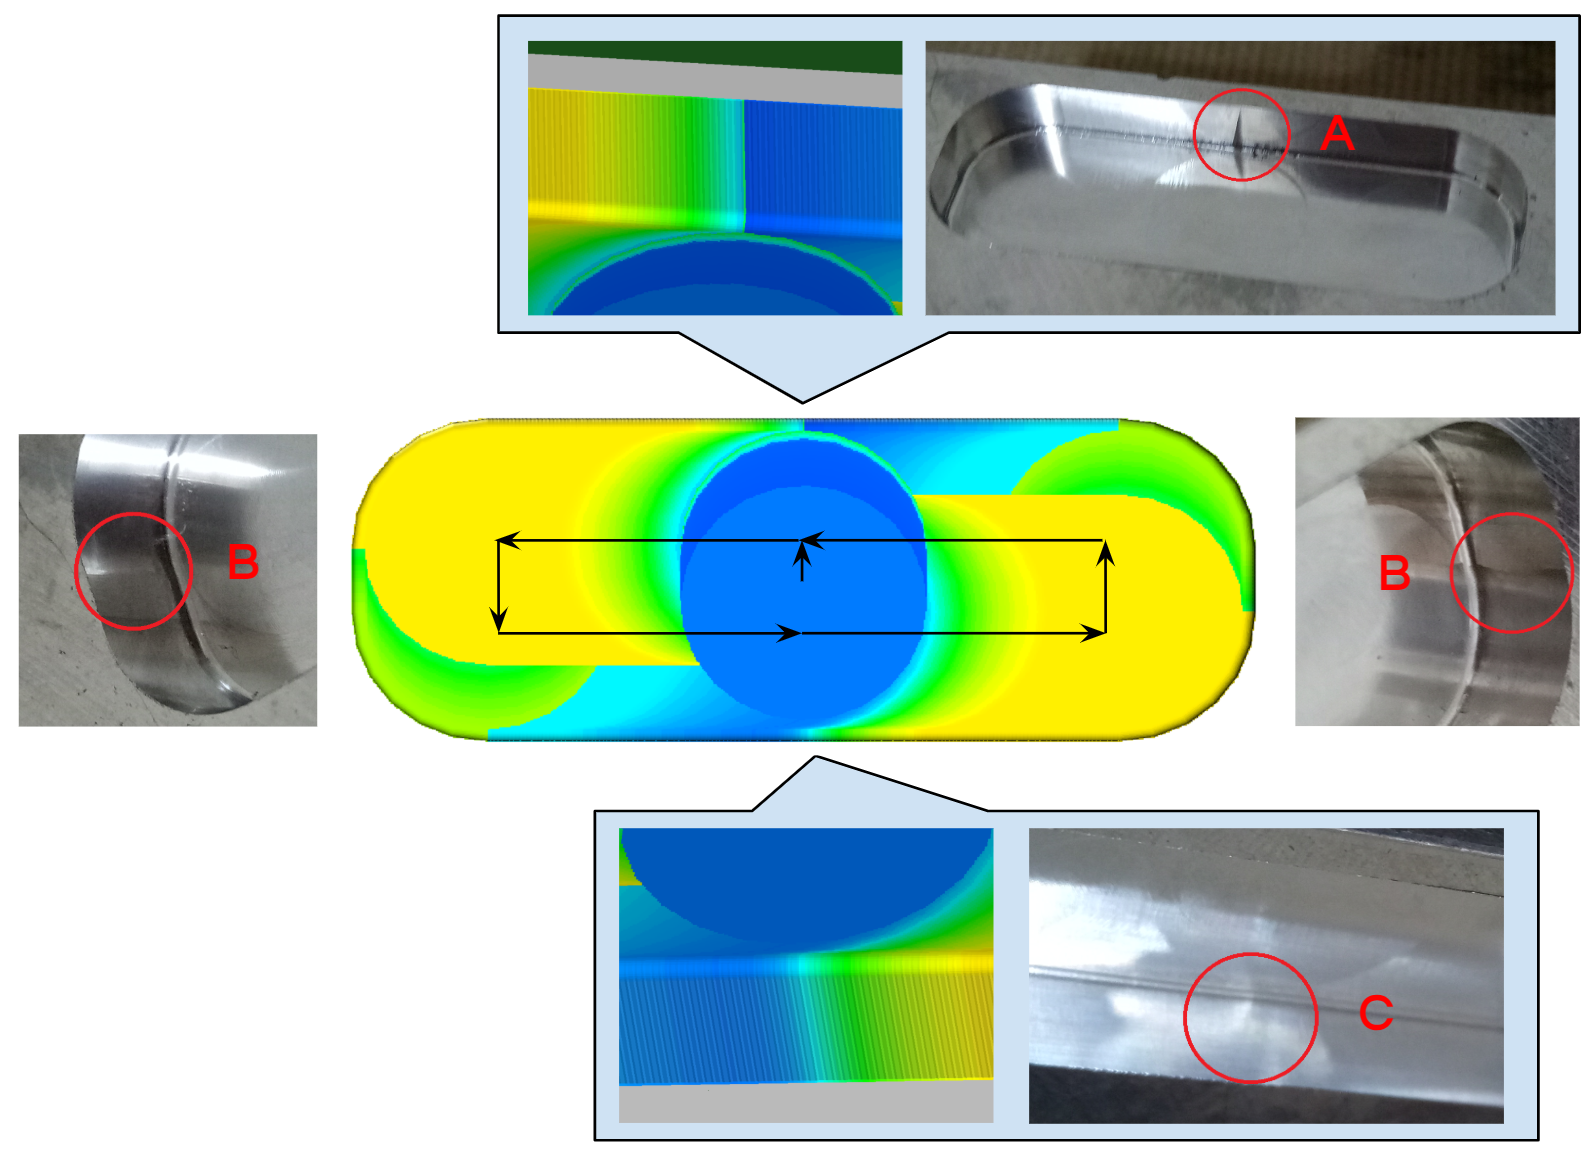
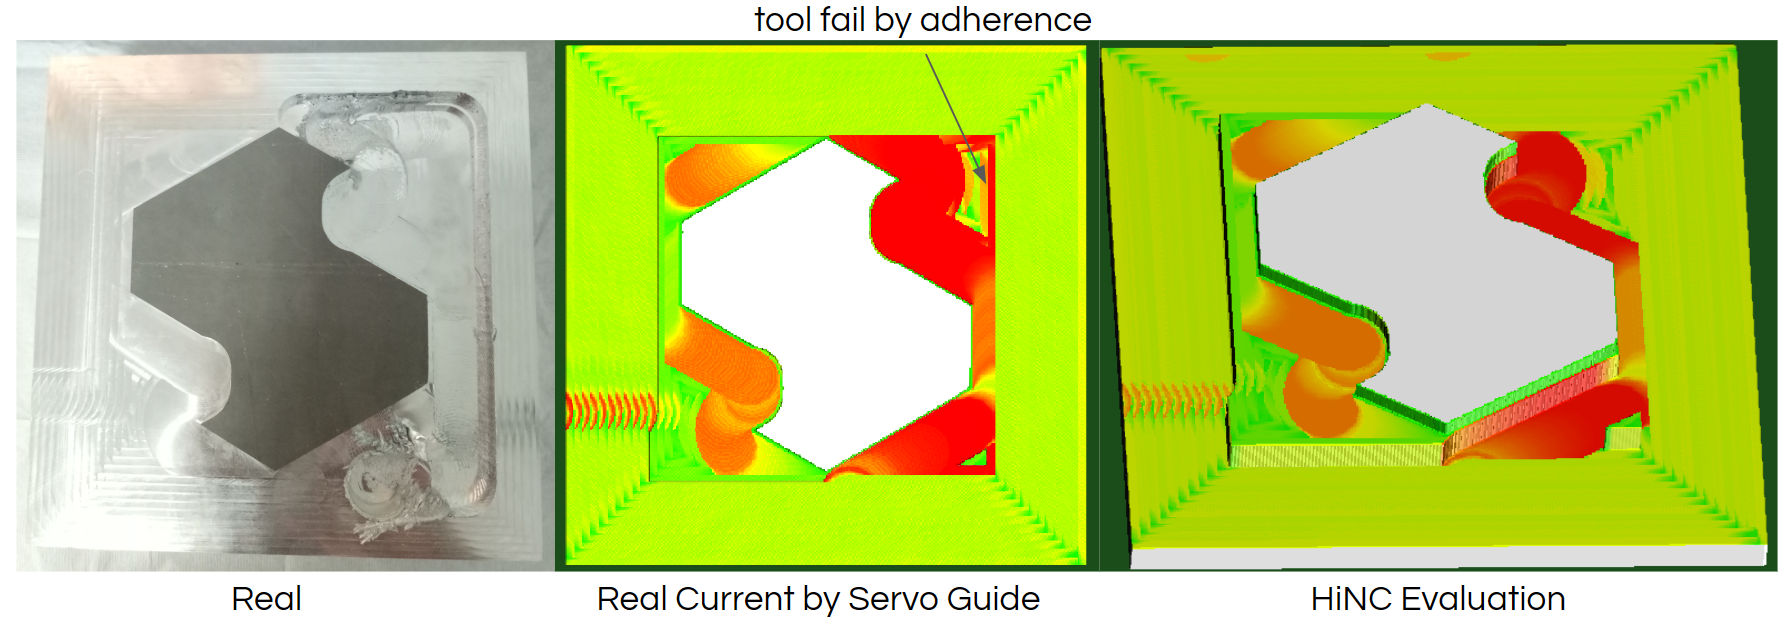
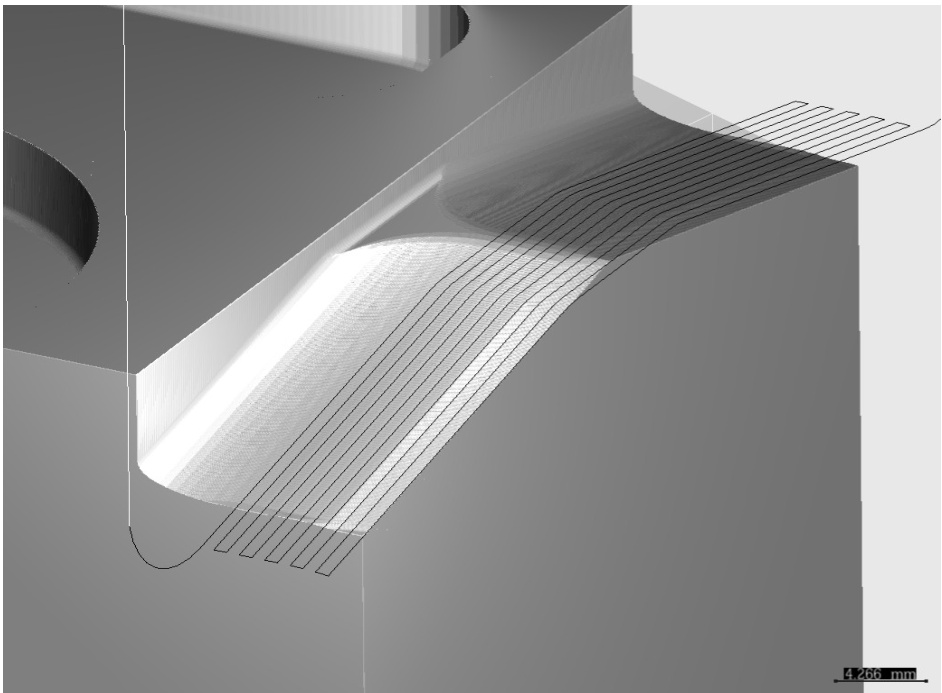
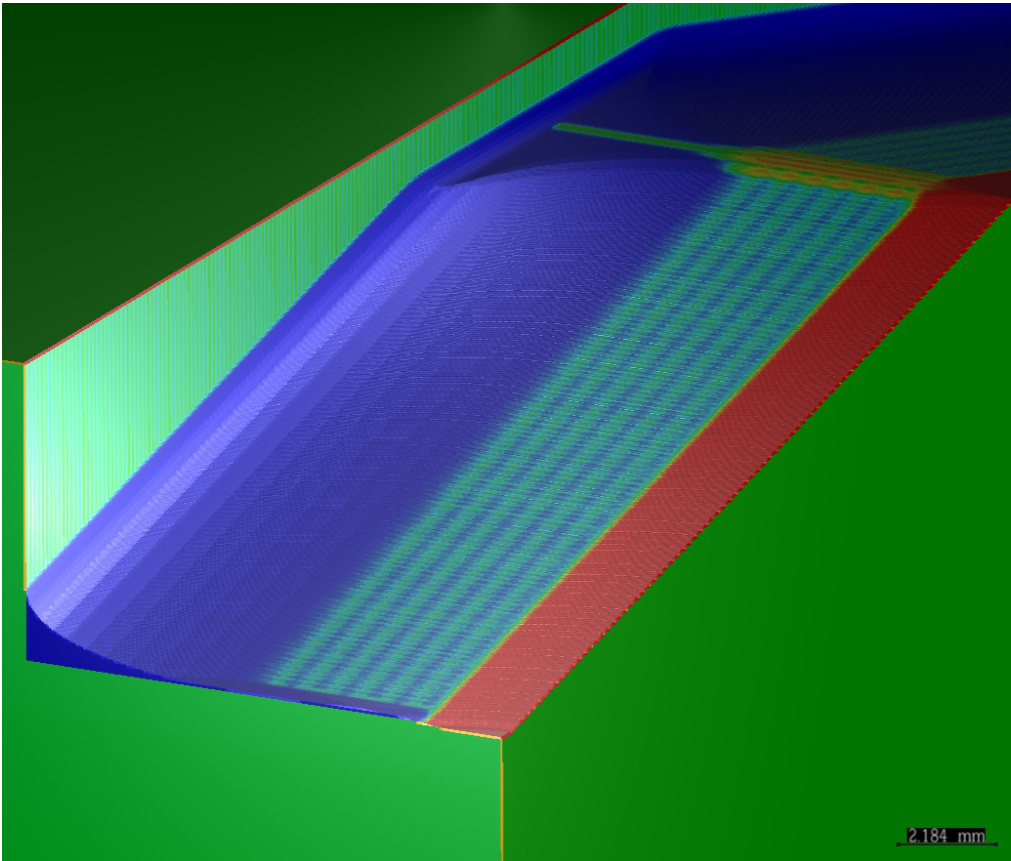
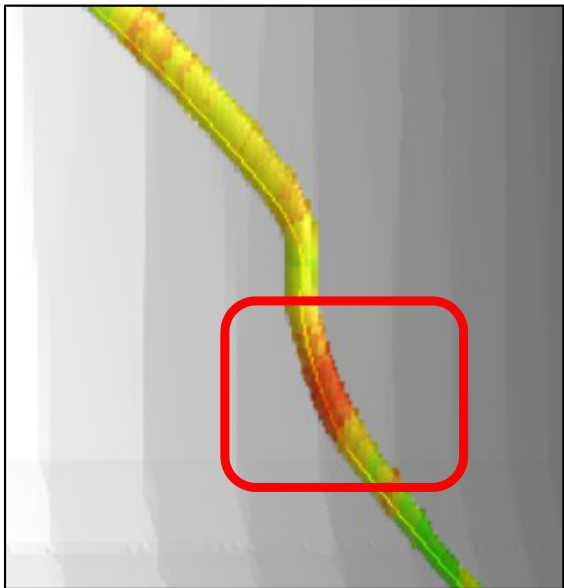
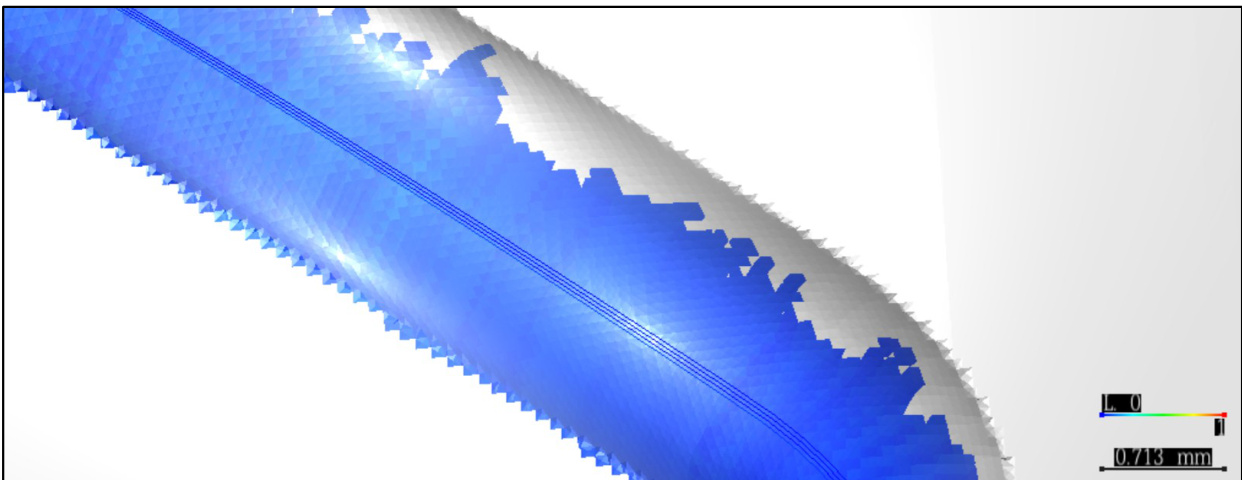
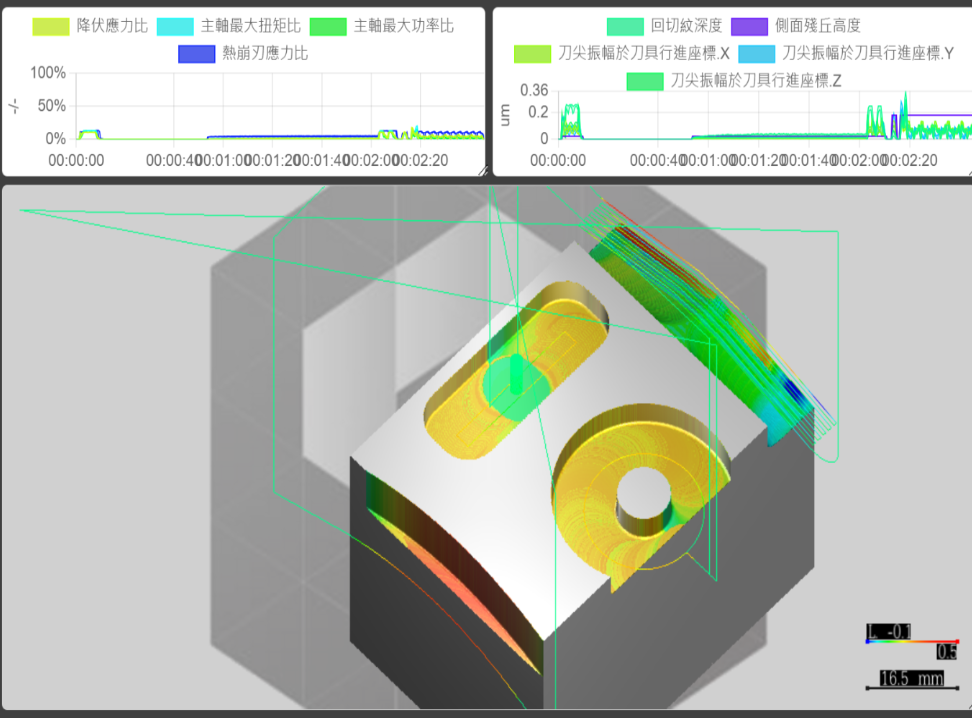
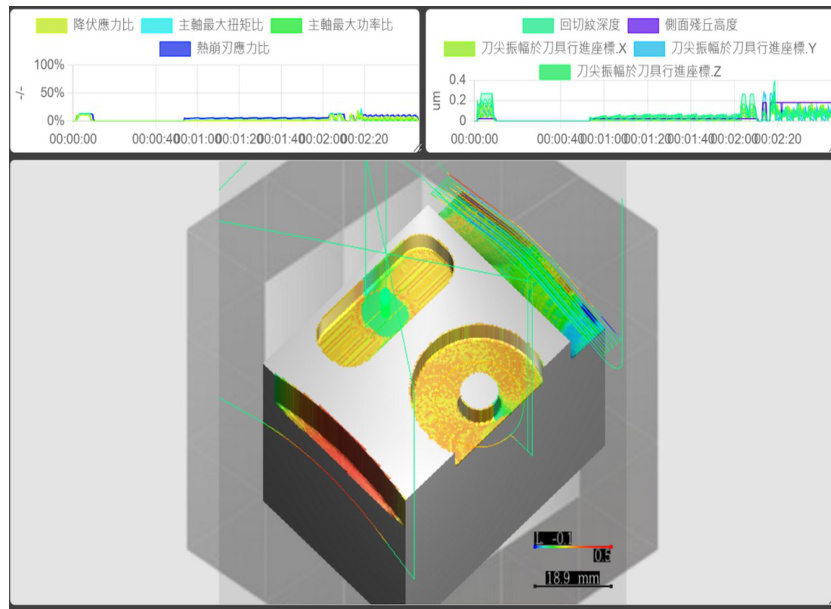
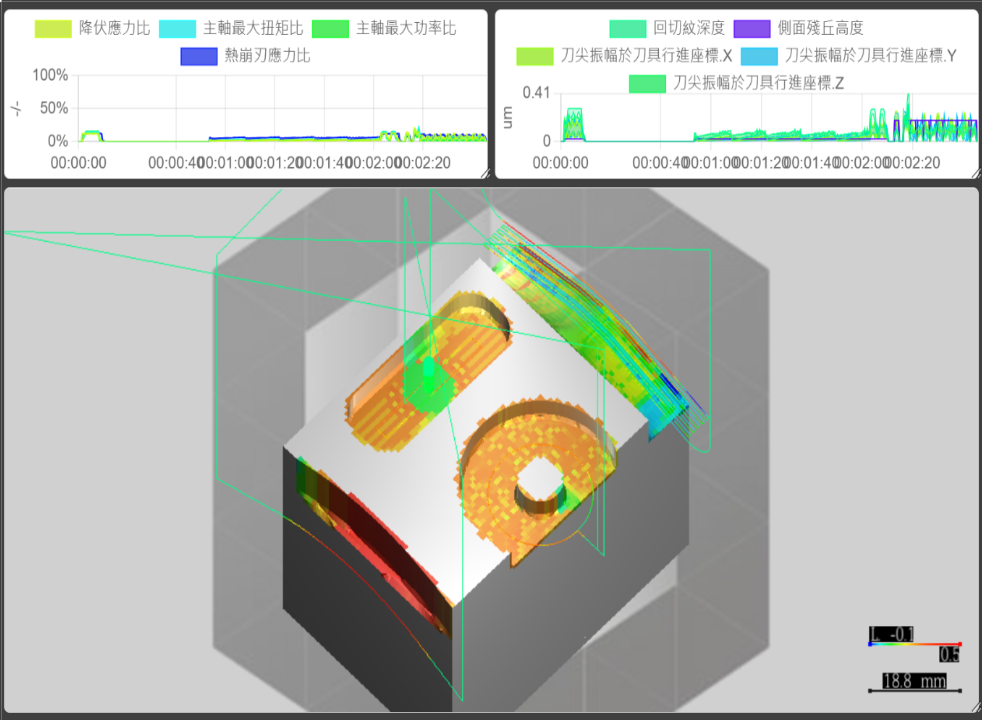
Examine machining surface based on torque changes
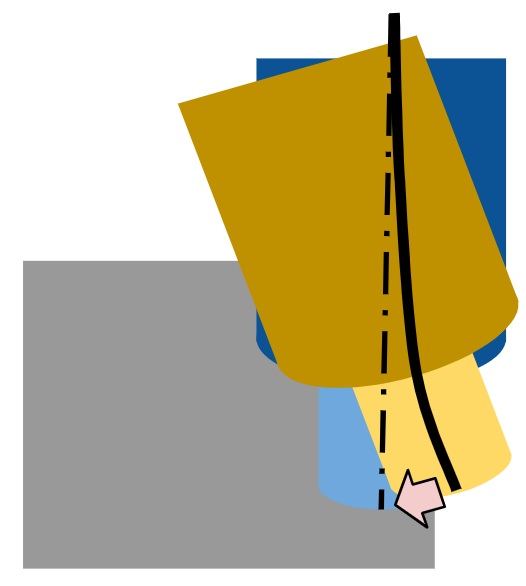
When torque experiences abrupt changes, the spindle output power lags behind the power required to maintain rotational speed, resulting in cut marks on the machined surface. Additionally, cutting forces causing tool deflection can also generate noticeable cut marks on the workpiece.
A. The gradient of spindle torque on the surface is high, tool mark is obvious.
B. Tool Mark at both sides.
C. The gradient of spindle torque on the surface is low, tool mark is obscure.
Blue, green, yellow, red indicate values from small to large.
Spindle Energy Consumption Simulation Verification
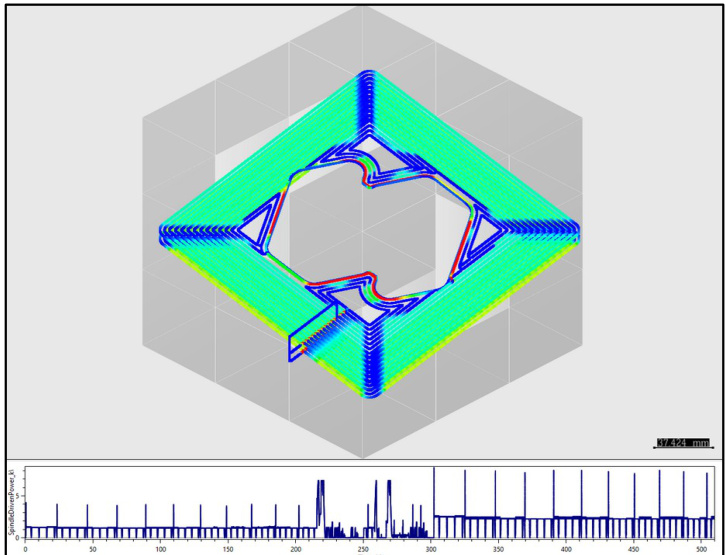
Pre-evaluate spindle energy consumption through simulation.
Simulated cutting power matches actual spindle power.
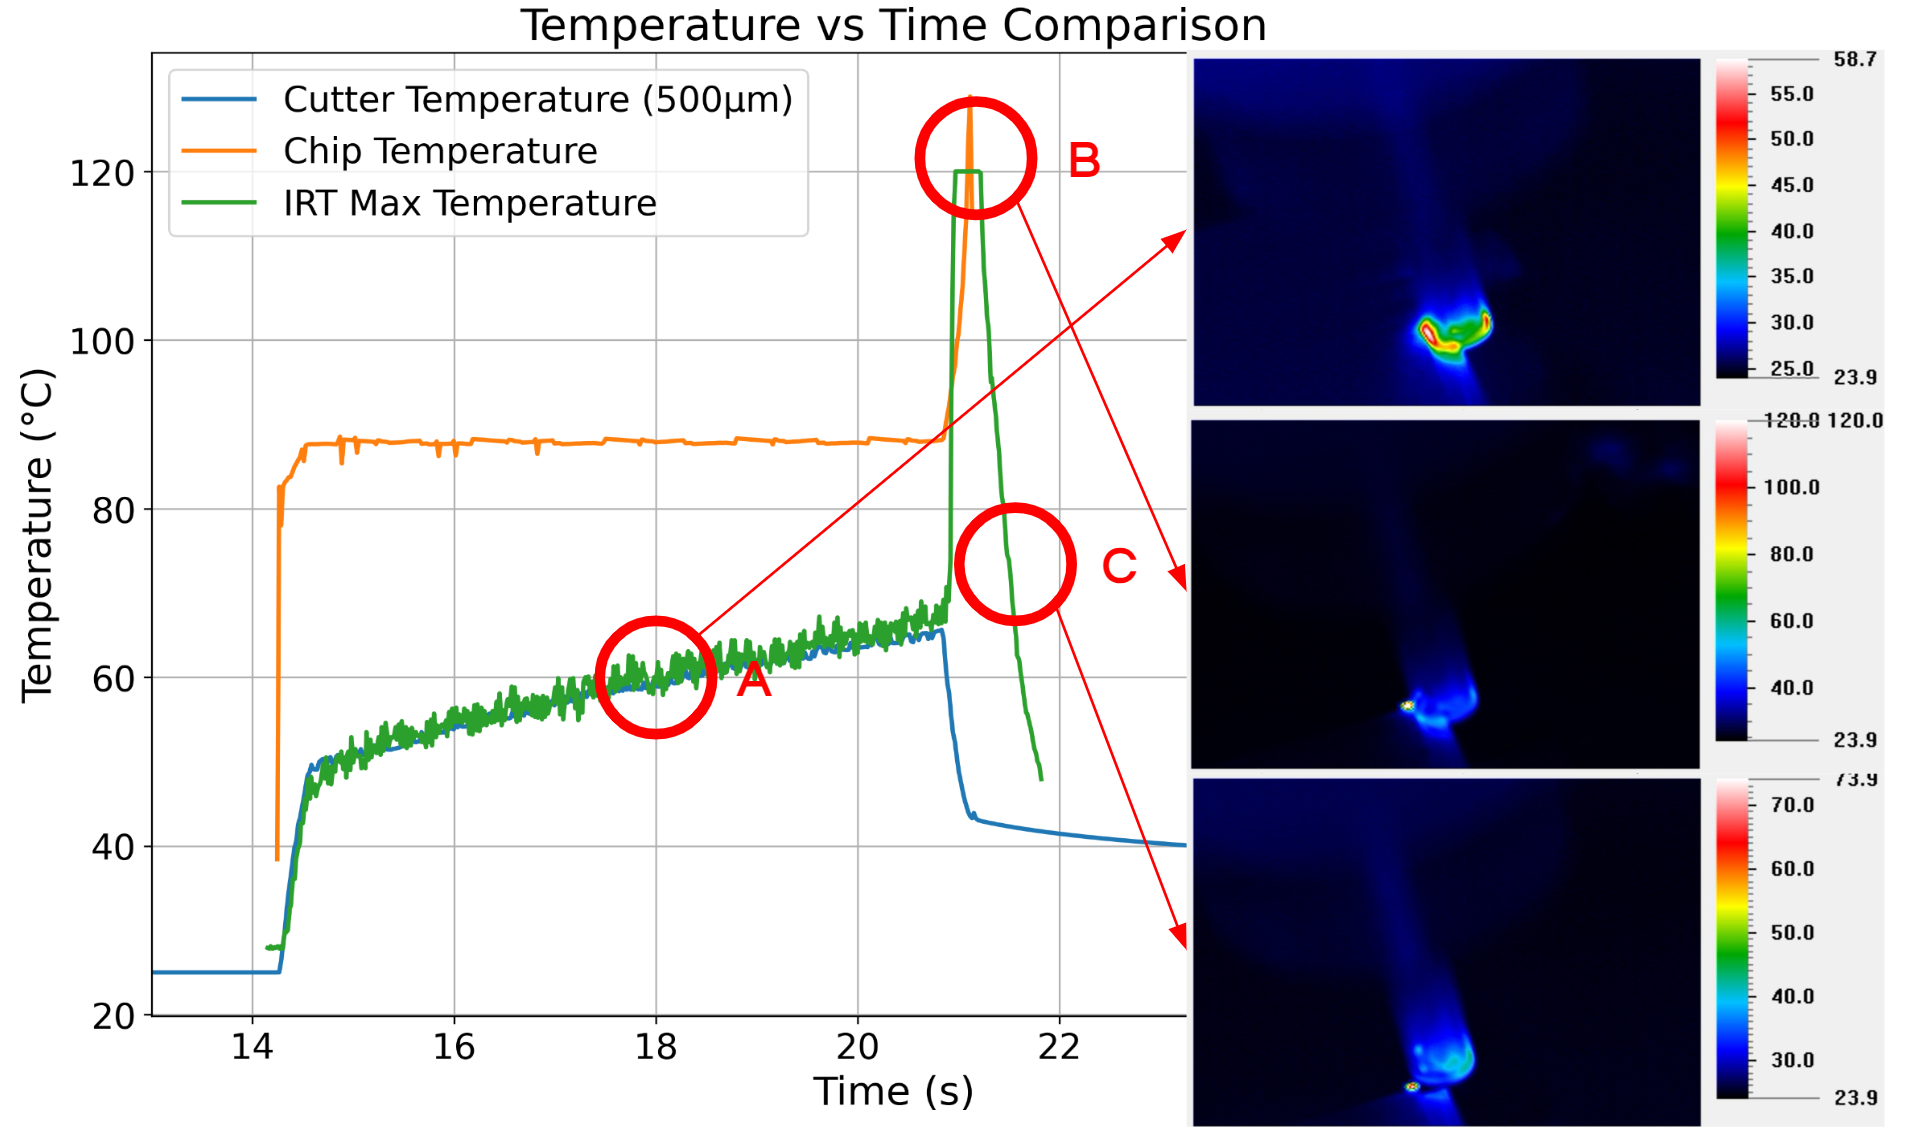
Verification of Simulated Milling Temperature Using IRT
A. The IRT-measured temperature aligns with the simulated cutter temperature at a 0.5mm depth.
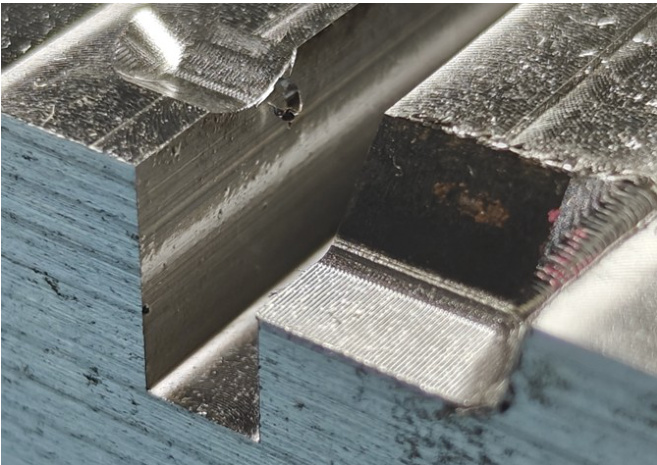
B. The high temperature observed on the burr corresponds to an unescaped chip. The IRT temperature matches the simulated chip temperature.
C. The last graph indicates that the temperature peak originates from the burr.
Maximum Feed Rate Settings
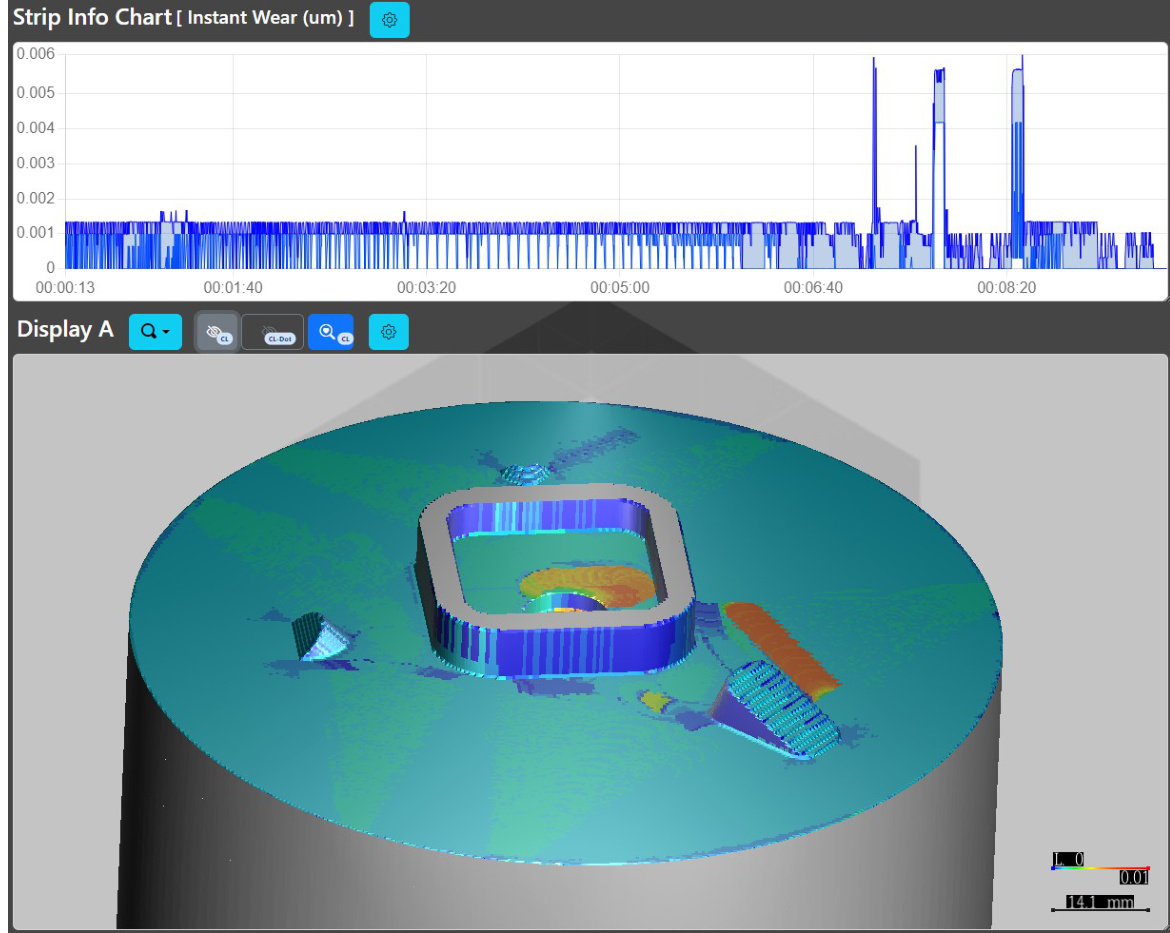
Wear Evaluation
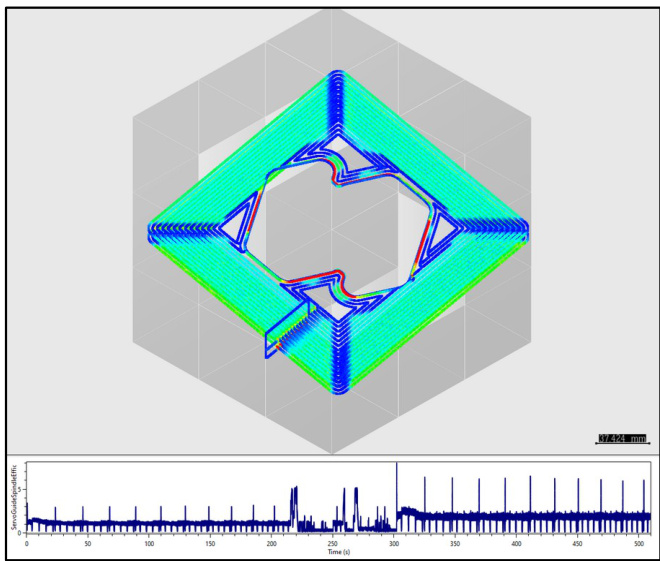
Torque Overload Detection
Cutting Force Anomaly Cases
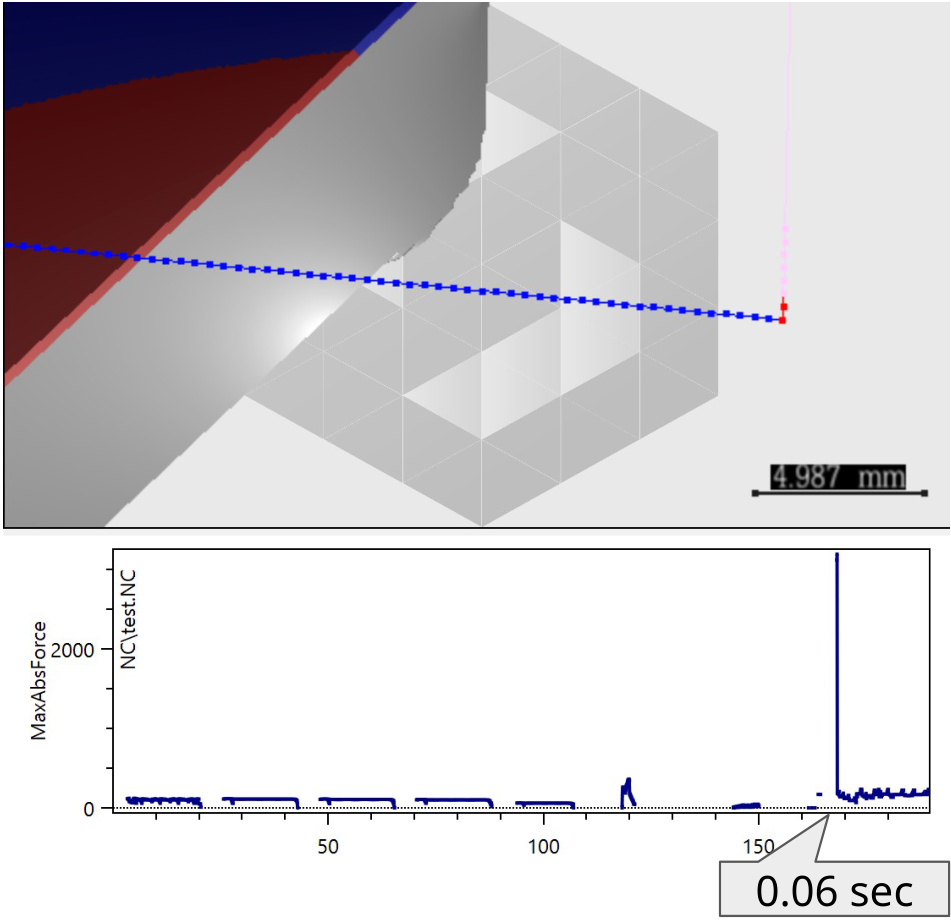
Case I: Face milling, thin workpiece
Not fully entering from side. About 10-30 times force of normal cutting.
Initially, engineers suspected a clamping setup issue. However, further analysis revealed the problem originated from the NC toolpath. A face milling operation in the extensive NC program caused clamping failures due to its direct downward movement, which could impact the workpiece when the cutter flute rotates into the critical area. Due to the intermittent nature of this issue, some processes completed successfully without errors. This issue led to severe clamping instability and significant yield loss. The brief duration of the impact made it difficult to detect during operation.
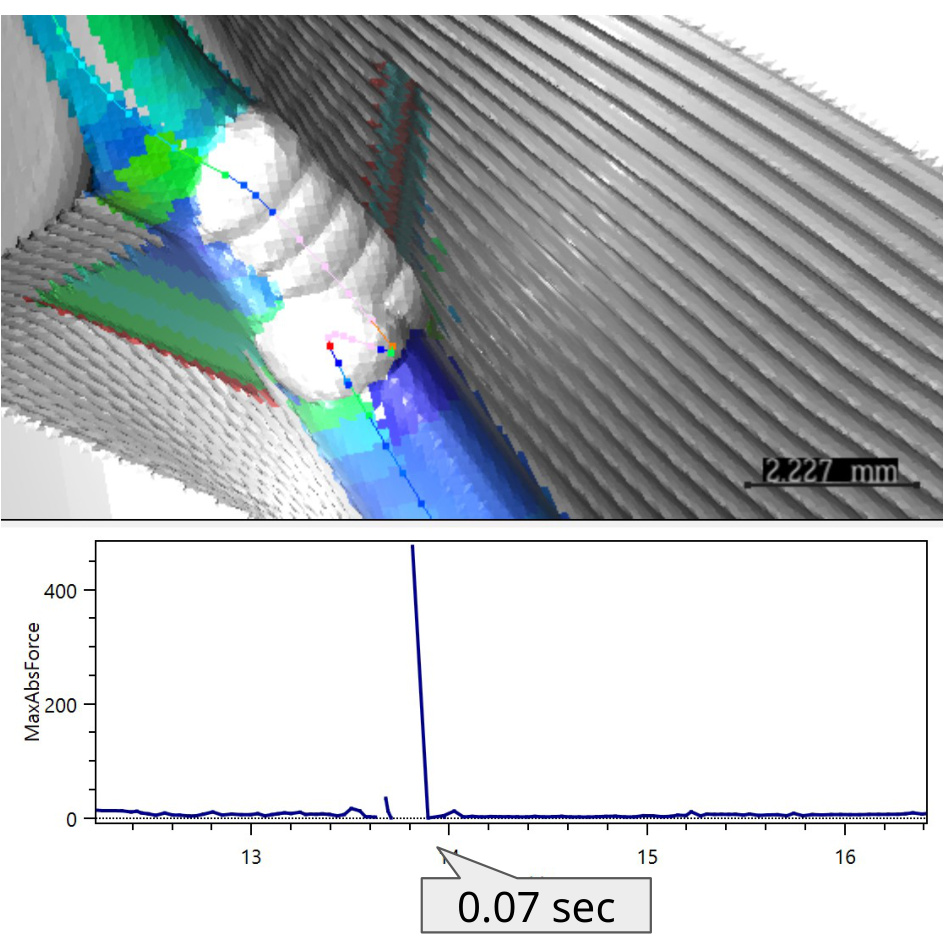
Case II: Impeller, medium milling
3-Axis FDAC High Hardness Mold NC Feed Rate Optimization Result Comparison
Bull Nose Cutter
| Parameter | Fixed Feed | Optimized Feed |
|---|---|---|
| Feed Rate | 120 mm/min | Variable |
| Expected Machining Time | 303min | 95min (31%) |
| Tool Breakage Time | 217min | No breakage |
Ball Cutter
| Parameter | Fixed Feed | Optimized Feed |
|---|---|---|
| Feed Rate | 220 mm/min | Variable |
| Machining Time | 125min | 74min (59%) |
| Measured Wear Depth | 50um | 20um (40%) |
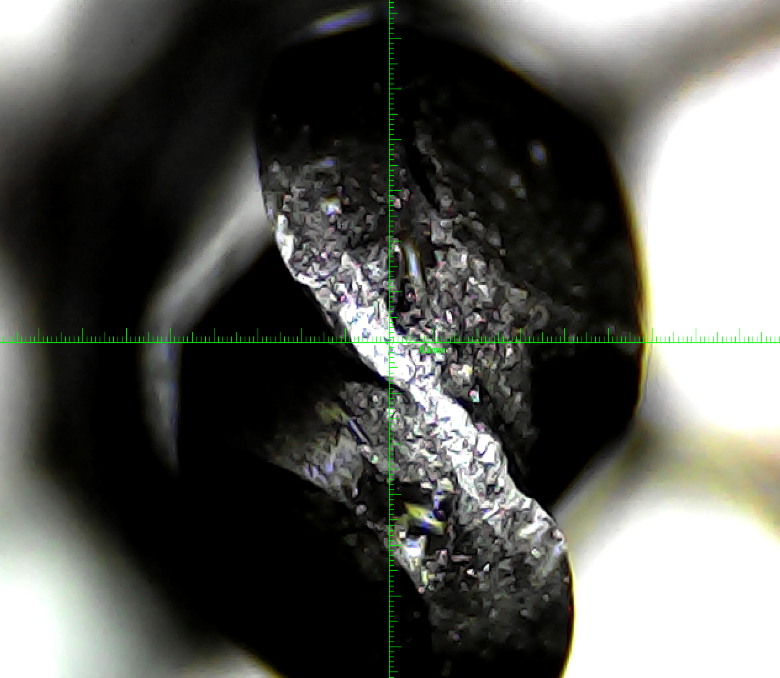
Wear Comparison from Ball Cutter
5-axis free-form surface rough machining Ti6Al4V Feed Rate Optimization Result Comparison
Original NC code
- Simulated machining time 181 sec
- Simulated tool wear 13.1 um
- High probability of tool breakage from overcut, low yield
Optimized NC code
- Simulated machining time 79 sec (56% reduction)
- Simulated tool wear 8.9 um (32% reduction)
- Eliminated overcut tool breakage, high yield
Function Menu
Virtual Machine Tool Construction
Diverse Cutting Tool Support
High Precision Simulation
Geometry Difference Detection
NC Physics Simulation
Feed Rate Optimization
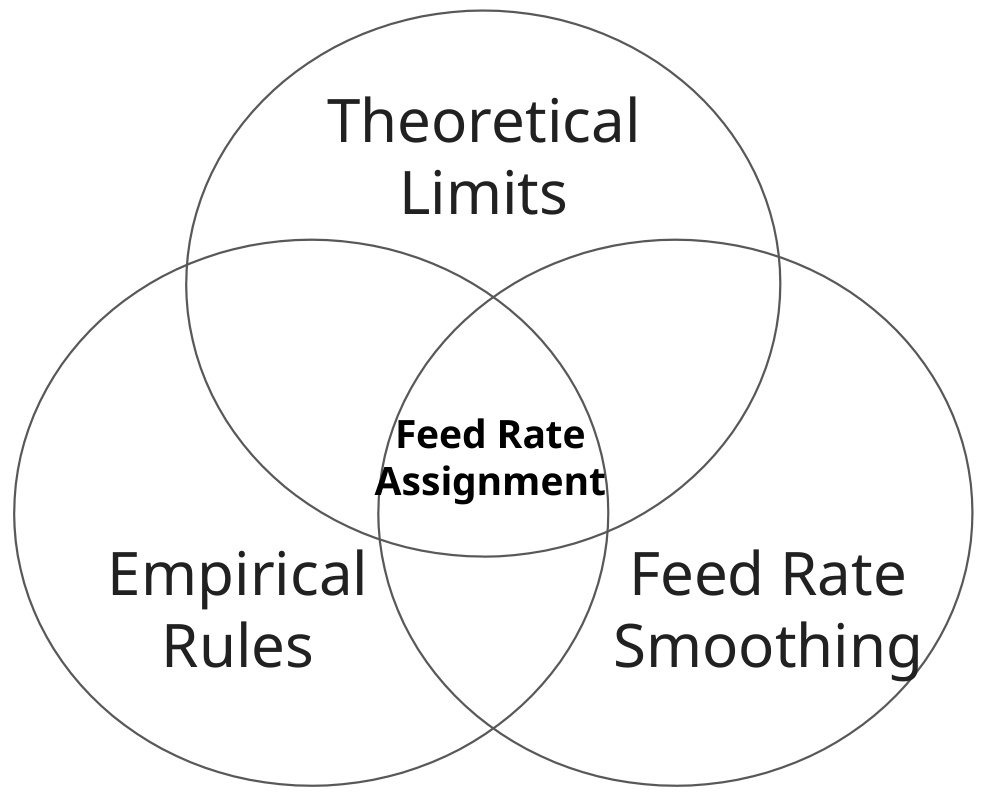
Feed Rate Optimization interpolates the NC code and ensures stable cutting through cutting force regulation and feed rate smoothing.
Feed rate optimization employs comprehensive constraints based on physical and empirical rules:
HiNC Advantages
- Reduce Rough Cutting Cycle Time: 30-70% cycle time reduction
- Enhance Fine Cutting Precision: Up to 10μm deviation reduction in hardened materials
- Extend Tool Service Life: Significant tool wear reduction of 60% observed
- Optimize Production Yield Rate: Over 30% yield improvement in problematic cases
- Minimize Product Development Lead Time: Saves approximately one week of on-site trial and error in challenging projects
HiNC Capabilities and Implementation Guidelines
Controller Compatibility
- Full 5-axis RTCP capability Supports common ISO controller commands, compatible with:
- Fanuc
- Siemens
- Heidenhain
- Syntec
- Complex macro programming not supported.
- Primary testing conducted with Fanuc syntax.
- Supports Heidenhain LN-Block Programming syntax.
HiNC Machining Simulation Compatibility
The current version supports milling operations only. Turning and tapping operations are not supported at this time.
Impact of Feed Rate Acceleration
HiNC currently does not simulate feed rate acceleration effects. Instead, it applies the programmed feed rates from the NC code directly. In most cases, the actual feed rate decreases at corners, resulting in lower cutting forces than simulated values, thus maintaining safety margin compliance.
Corner feed rates typically recover to programmed values within 5 spindle revolutions (approximately 100ms), depending on controller settings.
Impact of Strain-Hardening
The depth of cut in milling operations significantly exceeds the strain-hardened layer produced by previous cuts, therefore the strain-hardening effect has minimal impact on the machining process.
Chatter Management
Cutter Chatter
Prevent cutter chatter by optimizing NC programs with the Preferred Cutting Force option.
Chatter will not occur when cutting forces remain below the threshold value. This threshold varies based on machine conditions - well-maintained machines typically exhibit higher cutting force thresholds.
Workpiece Chatter
Workpiece chatter estimation is not currently supported.
Fixed Frequency Vibration
Fixed frequency vibration occurs due to machine conditions and is independent of NC toolpath. Avoid setting spindle speeds that coincide with harmonic frequencies of the machine.
Equipment Condition Management
HiNC allows adjustment of key safety factor values to accommodate varying machine and cutting tool conditions. These settings directly influence NC optimization results.
Stable Machining Requirements
Simulation effectiveness is maintained only under stable machining conditions. Keep all feasibility values within 100% in HiNC to ensure process stability.
For machines with suboptimal maintenance conditions, reduce cutting forces to maintain process stability.
Cutting Force Reduction Methods
The most straightforward approach to reduce cutting forces is decreasing feed per tooth. When this approach proves insufficient, consider reducing cutting depth or width of cut.
Mesh Resolution and Simulation Performance Guidelines
Initial simulations typically use lower mesh resolution for rapid results. Higher mesh resolution is applied during final optimization phases.
Simulation processing time typically ranges from 2% to 150% of actual machining time.
Relation between Mesh Length and Physical Simulation
Physical simulation values for this test case method [slot milling, downward, circular, varying width and depth milling] are less affected by grid (within about 20%).
This test case has no thin shell, if grid width exceeds thin shell thickness, thin shell may disappear.
Workpiece size 70x50x50 (mm)
Machining Time Estimation
HiNC's machining time estimation is calculated based on:
- NC/CL ideal feed rate
- Maximum rotary axis speed limits
This approach provides time estimates closely matching those from official controller manufacturer simulators, without accounting for dynamic behavior effects.
Impeller 5-axis machining example:
Heidenhain simulator cutting time: 15 hours 2 minutes
HiNC simulator cutting time: 15 hours 5 minutes
Error: 0.39%
However, it's important to note that actual machining times may significantly differ from simulated times (even when using official controller simulators) due to real-world dynamic behaviors.
System Requirements
Memory (RAM)
- Minimum: 8GB RAM (suitable for low-resolution models)
- Recommended: 128GB RAM or higher (for large and detailed models)
Graphics
- OpenGL 4.4 compatible graphics card or integrated graphics
- (Most computers manufactured within the last 15 years meet this requirement)
Operating Systems
- Windows 10 or later
- Ubuntu 22.04 LTS
HiNC Deployment
HiNC can be deployed either as a self-hosted local application or as a cloud-based solution.
